# 12.3 Field experiments
Field manipulative experiments include, for example, caging experiments to exclude or include predators, controlled pollution of experimental plots, and big-bag experiments with plankton. Their use was historically (unsurprisingly) predominantly for univariate *population* rather than *community* studies, although some early examples of multivariate analysis of manipulative field experiments include {{@224#bkmrk-anderson1997a}}, {{@224#bkmrk-morrisey1996a}}, {{@224#bkmrk-gee1997a}} and {{@224#bkmrk-austen2001a}}. The following example is one in which univariate, graphical and multivariate statistical analyses have been applied to meiobenthic communities.
**Azoic sediment recolonisation experiment with predator exclusion *{Z}***
{{@224#bkmrk-olafsson1992a}} studied meiofaunal colonisation of azoic sediment in a variety of cages designed to exclude epibenthic macrofauna to varying degrees: A – 1 mm mesh cages designed to exclude all macrofauna; B –1 mm control cages with two ends left open; C – 10 mm mesh cages to exclude only larger macro-fauna; D – 10 mm control cages with two ends left open; E – open unmeshed cages; F – uncaged background controls. Three replicates of each treatment were sampled after 1 month, 3 months and 8 months and analysed for nematode and harpacticoid copepod species composition.
***Univariate indices.*** The presence of cages had a more pronounced impact on copepod diversity than nematode diversity. For example, after 8 months, $H ^ \prime$ and $J ^ \prime$ (but not $S$) for copepods had significantly higher values inside the exclusion cages than in the control cages with the ends left open, but for the nematodes, differences in $H ^ \prime$ were of borderline significance (*p* = 5.3%).
***Graphical/distributional plots.*** No significant treatment effect for either nematodes or copepods could be detected between *k*-dominance curves for all sampling dates, using the ANOSIM test for curves, referred towards the end of [Chapter 8](https://learninghub.primer-e.com/books/change-in-marine-communities/chapter/chapter-8-diversity-measures-dominance-curves-and-other-graphical-analyses) ([page 8.5](https://learninghub.primer-e.com/books/change-in-marine-communities/page/85-multivariate-tools-used-on-univariate-data)).
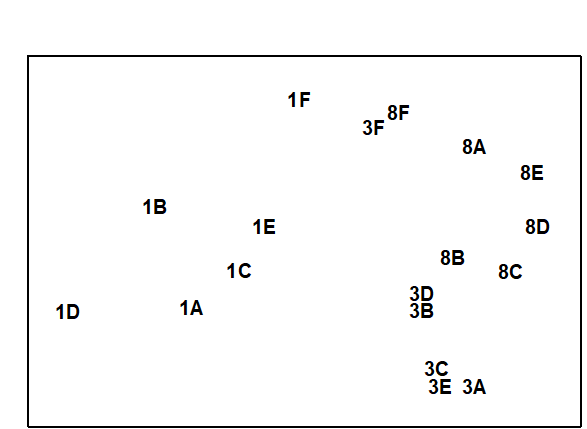
***Multivariate analysis.*** For the harpacticoid copepods there was a clear successional pattern of change in community composition over time (Fig. 12.4), but no such pattern was obvious for the nematodes. Fig. 12.4 uses data from Table 2 in Olafsson and Moore’s paper, which are for the 15 most abundant harpacticoid species in all treatments and for the mean abundances of all replicates within a treatment on each sampling date. On the basis of these data, there is no significant treatment effect using the 2-way crossed ANOSIM test with no replication¶ (see [page 6.8](https://learninghub.primer-e.com/books/change-in-marine-communities/page/68-example-mesocosm-experiment-two-way-crossed-case-with-no-replication)), but the fuller replicated data may have been more revealing.
[](https://learninghub.primer-e.com/uploads/images/gallery/2022-03/ch12fig12-4.png)
***Fig. 12.4. Azoic sediment recolonisation experiment {Z}.** MDS configuration for harpacticoid copepods (4th root transformed abundances) after 1, 3 and 8 months, with 6 different treatments (A–F), see text (stress = 0.07).*
---
¶ *Note, however, that this test (or the equivalent PERMANOVA test which exploits the interaction term as its residual) will be uninformative in the presence of large treatment $\times$ time interactions, which is a likely possibility here.*