# 2. Getting data in to PRIMER
# Getting example data
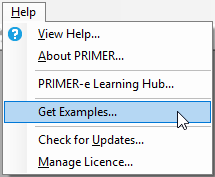
You can get a full set of **Example datasets** from within the software. To access them click **Help** > **Get Examples...** and choose the folder to place them in. The default name for this folder is 'Examples_P8'. These datasets are used and referred to in the software documentation (including this book!).
[](https://learninghub.primer-e.com/uploads/images/gallery/2026-02/help-menu-get-examples.png)
We highly recommend working through the manuals available on our [**Learning Hub**](https://learninghub.primer-e.com/), and replicating the examples given there with the **Example datasets**. This is an excellent way to familiarize yourself with the software and its many routines.
# Opening example data
#### Data from the Fal estuary
Example datasets can be obtained *via* the **Help** menu item. Click **Help** > **Get Examples...**, and you can download the folder of examples called 'Examples_P8' to a location of your choice. Inside this folder, there are individual folders that hold a plethora of datasets. Here we will focus on data from a study of benthic infaunal communities in soft sediments from 27 sites over five creeks of the Fal estuary, SW England ({{@483#bkmrk-somerfieldetal1994a}}, {{@483#bkmrk-somerfieldetal1994b}}). Sediments at these sites were contaminated to varying degrees by heavy metals, from historic mining activities. Both faunal counts and environmental measures were obtained from the same set of sites. The data files from this study are located in a folder called 'Fal_benthic_fauna' inside 'Examples_P8'.
Here, we shall focus on data for the ***nematodes***, located in the file named 'Fal_nematode_abundance.pri', which contains abundances of 62 nematode species x 27 sites. Note that the extension **\*.pri** indicates a file containing a data matrix that has been saved in PRIMER's own internal binary format. (These data are also available in Excel format in the file called 'Fal_nematode_abundance.xlsx'.)
#### Open the Fal data in PRIMER
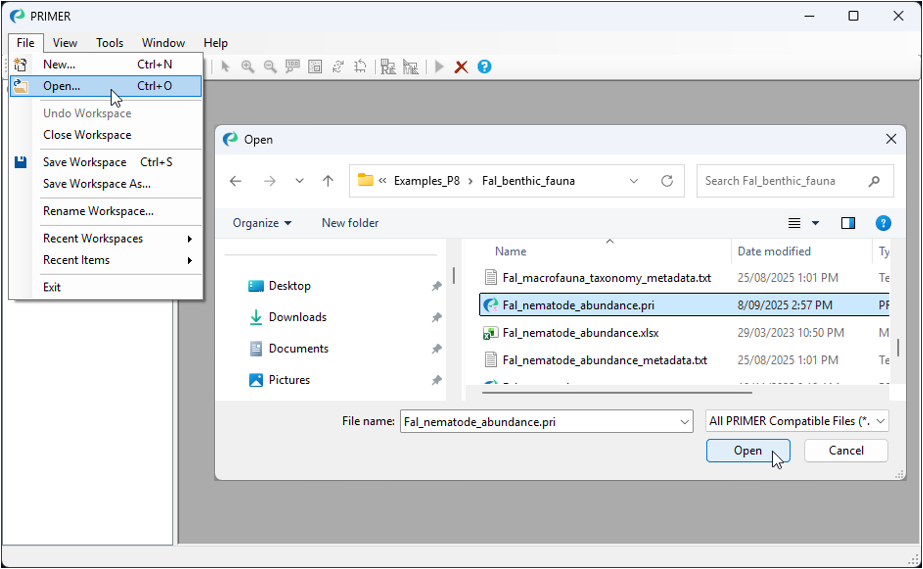
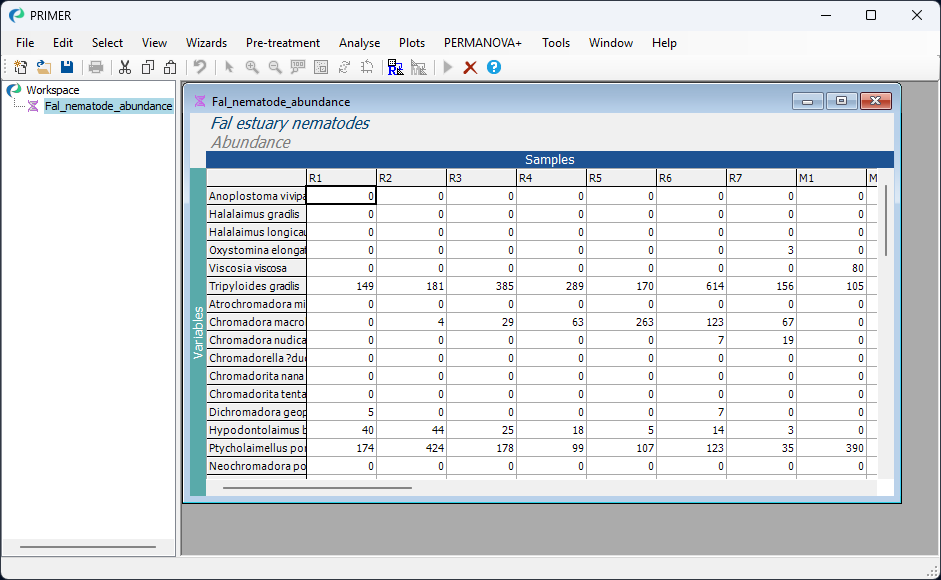
To open the species-by-samples data matrix, launch PRIMER, then click **File** > **Open** from the main menu, navigate to the 'Fal_benthic_fauna' folder inside the 'Examples_P8' folder (in the location you had specified for it), and select 'Fal_nematode_abundance.pri'. Click **Open** to display the species matrix.
[](https://learninghub.primer-e.com/uploads/images/gallery/2026-02/02-open-fal-data-all.png)
Alternatively, because this is a PRIMER file type (**\*.pri**), you can instead use Windows Explorer to navigate to the 'Fal_benthic_fauna' folder and just double-click on the file name. This will launch a PRIMER session, with the data matrix open in the PRIMER desktop.
[](https://learninghub.primer-e.com/uploads/images/gallery/2026-02/03-fal-datasheet-in-primer.png)
#### Properties of the data
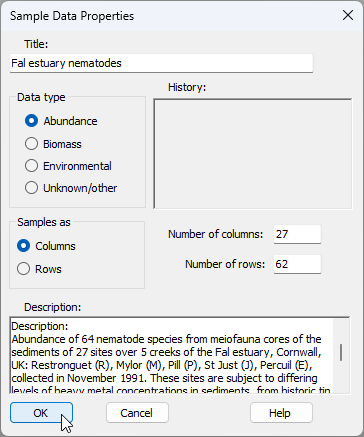
Click on **Edit** > **Properties** and you will see that PRIMER-format **\*.pri** data sheets carry other information about the data matrix as well, including:
- Title,
- Data type,
- Array size (number of columns and rows),
- Orientation (whether samples are found in columns or rows),
- a Description, and
- a History of what pre-treatments (such as a transformation) have been applied to them.
[](https://learninghub.primer-e.com/uploads/images/gallery/2026-02/04-sample-data-properties.png)
#### Factors associated with the data
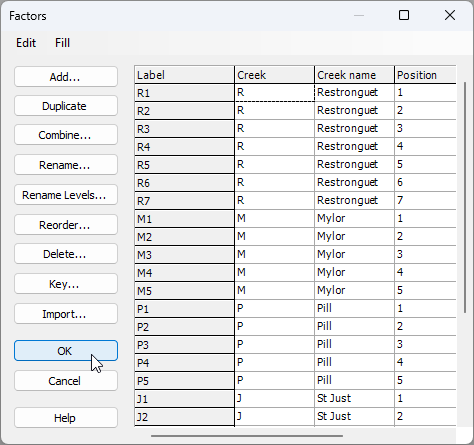
Click on **Edit** > **Factors...**, and you can see that a subsidiary sheet of three factors is also linked to this worksheet: 'Creek', a single-letter abbreviation for the creeks, the full 'Creek name' and a numeric 'Position' factor identifying the location of each sampling site down each creek.
[](https://learninghub.primer-e.com/uploads/images/gallery/2026-02/05-factors.png)
Note that additional factors could be added here by clicking **Add**, and also combinations of levels of existing factors can be created by clicking on **Combine**.
# Importing data from Excel
#### Step 1. Ensure your data are in a format suitable for import into PRIMER
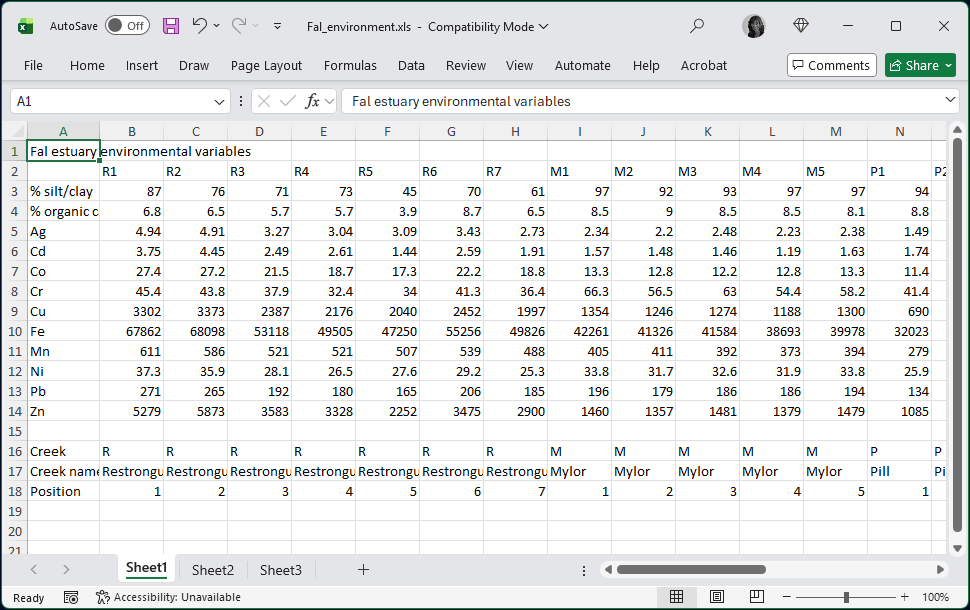
Suppose we have a dataset in Excel that is already in a suitable format for import into PRIMER. The environmental data from the Fal estuary provides an example of this. These data are found in the file 'Fal_environment.xls' and consist of values for each of 12 environmental variables measured from sediments collected from 27 sites across 5 tidal creeks in the Fal Estuary (available in the folder called 'Fal_benthic_fauna' inside 'Examples_P8', obtained by clicking **Help** > **Get Examples...**, as seen in the last section).
[](https://learninghub.primer-e.com/uploads/images/gallery/2026-02/06-fal-env-excel.png)
***Important things to note about this file:***
- There is a ***title*** for the dataset ('Fal estuary environmental variables') in the very first (upper left-hand) cell (A1). This title is optional, but handy as a naming convention.
- The cell immediately under the title (cell A2) is ***empty***.
- There are ***column labels*** ('R1', 'R2', ...) in row 2. These are unique labels for the sampling units (Sites in this case).
- There are ***row labels*** ('%silt/clay', '% organic carbon', ...) in column A. These are unique names associated with each variable.
- The entries for every cell in the matrix of data itself (beginning with cell B3) all contain ***numerical values only***. There are no non-numeric characters. This means that you may not use 'NaN' or 'NAN' to denote missing values. If data are missing from a cell, then it should be left **blank**. In addition, symbols such as '<' or '>' (for 'less than' or 'greater than') are similarly not permitted or accepted as valid data values within the data matrix.
- In this example, the variables are rows and the sampling units (sites) are columns. It is perfectly ok to have this formatted the other way around, with variables as columns and sampling units as rows. You will specify the orientation of your data matrix explicitly when you import your Excel file into PRIMER.
This format must be adhered to precisely, with no extra blank rows or columns, or extra headers, otherwise PRIMER will not be able to open it successfully.
***Other things to note:***
- **Factors:** You can label the sampling units as belonging to a level of one (or more) factors by **skipping a line** at the bottom of the matrix and placing this 'factor information' there. In the above image you can see that there are three factors: 'Creek' (row 16), 'Creek name' (row 17) and 'Position' (row 18).
- **Indicators:** You can similarly label variables as belonging to particular groups in the same manner; this is done along the *other* margin of the data matrix (e.g., after skipping a column, for this example). This might be useful for doing analyses on subsets of variables belonging to different types, such as physical vs chemical variables. In a case where variables are species, one might want to consider subsets of variables corresponding to families, functional groups, etc.
Inclusion of one (or more) *factors* (to specify groups of samples) or *indicators* (to specify groups of variables) is optional. If you have more than one factor, then these are given one after the next (in adjacent rows); do not put blank rows between multiple factors. Similarly, if you have more than one indicator, these would be given one after the next (in adjacent columns, for this orientation). The initial single blank row (or column) is there simply to demarcate the difference between the data matrix itself and additional information about the data matrix upon import.
#### Step 2. Open PRIMER and import the data from Excel
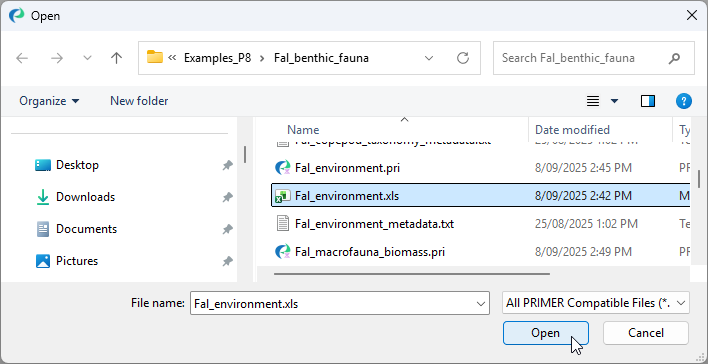
1. Once your Excel file is ready, open up PRIMER and choose **File** > **Open**, then click on the name of your Excel file in the browser (here it is 'Fal environment.xls'), then click **Open**.
[](https://learninghub.primer-e.com/uploads/images/gallery/2026-02/07-open-fal-env.png)
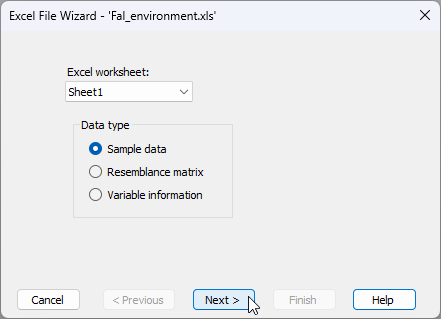
2. This will initiate PRIMER's Excel File data-import Wizard. Choose the name of the specific sheet within your Excel file that contains your data and the type of data you are importing. Here, we have (Excel worksheet: Sheet1) & (Data type $\bullet$Sample data), then click **Next >**.
[](https://learninghub.primer-e.com/uploads/images/gallery/2026-02/08-import-wizard-step1.png)
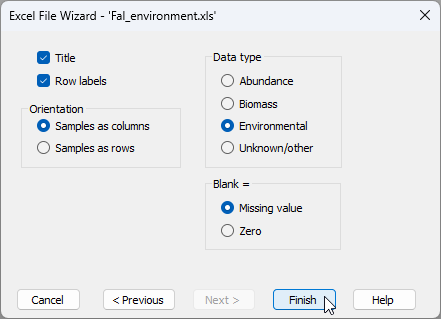
3. Choose the correct orientation, type of data and the meaning of blank entries (if any). For this example, we have (Orientation $\bullet$Samples are columns) & (Data type $\bullet$Environmental) & (Blank = $\bullet$Missing value), then click **Finish**.
[](https://learninghub.primer-e.com/uploads/images/gallery/2026-02/09-import-wizard-step2.png)
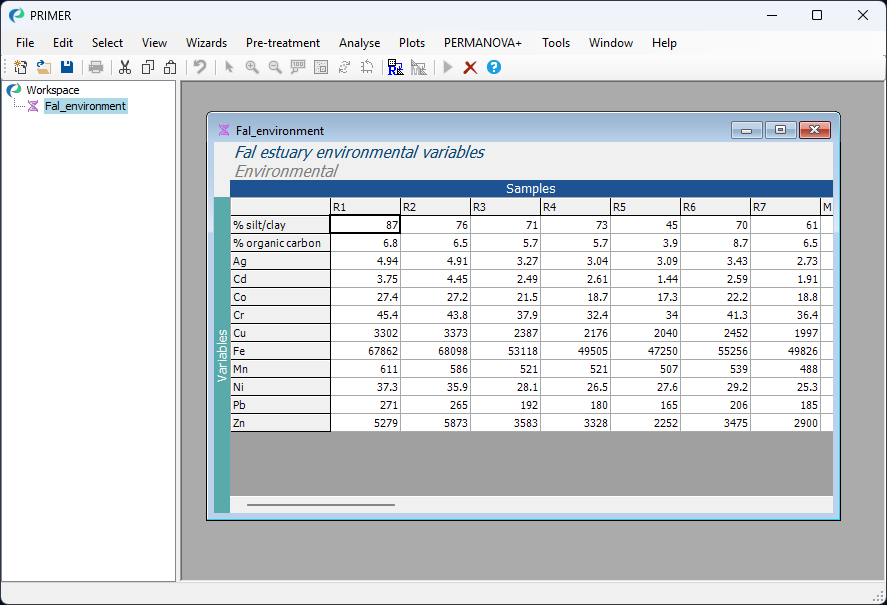
4. You will now see your data file has been imported and is nicely displayed in the PRIMER workspace. It appears in its own window, and its name also appears in the 'Explorer tree'-type window shown on the left-hand side of the PRIMER desktop.
[](https://learninghub.primer-e.com/uploads/images/gallery/2026-02/10-fal-env-in-primer.png)
Now that the data are in PRIMER, it is a good idea to do some post-import data checks.
# Post-import data checks
#### Check the orientation
After import, make sure you have specified the orientation correctly by examining the labels on the columns and rows of the data frame. For example, after importing the Fal environmental data from Excel (see the previous page), you can see that the columns are 'Samples' (a navy blue-coloured strip across the top) and rows are 'Variables' (a teal-coloured strip along the left margin).
[](https://learninghub.primer-e.com/uploads/images/gallery/2026-02/10-fal-env-in-primer.png)
If you happen to get this the wrong way around (e.g., if your variables are actually columns instead of rows), this can easily be changed (swapped around) by choosing **Edit** > **Properties** and toggling the radio button for 'Samples as' to either '$\bullet$Columns' or '$\bullet$Rows', whichever is appropriate.
#### Check the properties, factors and indicators
To be sure that the import has been fully successful, including all data points, factors and indicators that may have been included in your original Excel file, you can see additional information attached to your data matrix by clicking on your imported dataset in PRIMER, and doing the following:
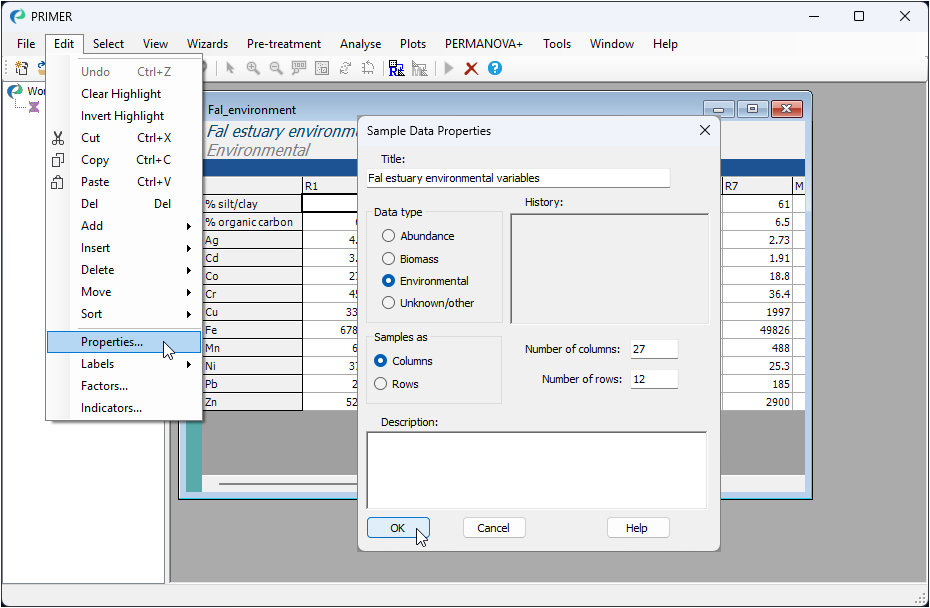
- Look at the data properties, size of the matrix, etc.: Click **Edit** > **Properties...**.
[](https://learninghub.primer-e.com/uploads/images/gallery/2026-02/13-fal-env-properties-all.png)
For the Fal environmental dataset, we can see there are 12 variables and 27 sites, etc. Note that you can add a useful 'Description' of your data into this dialog if you like.
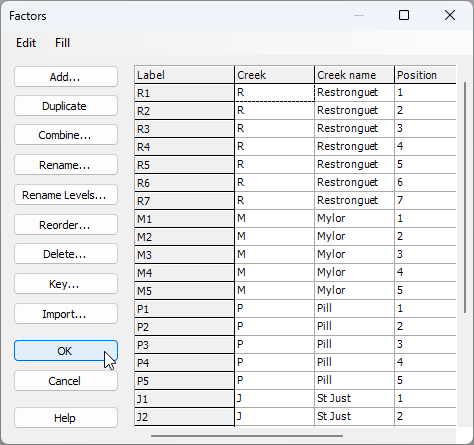
- Look at the Factors (if any): Click **Edit** > **Factors...**. For the Fal environmental dataset, you will see the same three factors of 'Creek', 'Creek name' and 'Position' that we saw in the Excel file.
[](https://learninghub.primer-e.com/uploads/images/gallery/2026-02/14-fal-env-factors.png)
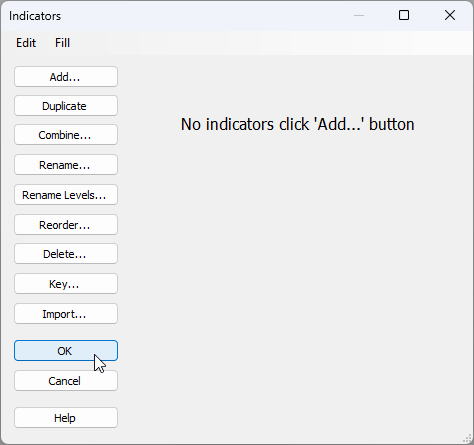
- Look at the Indicators (if any): Click **Edit** > **Indicators...**. For the Fal environmental dataset, there were no indicators, but you could add some here, if you wish.
[](https://learninghub.primer-e.com/uploads/images/gallery/2026-02/15-fal-env-indicators.png)
#### Run PRIMER's data-checking tool
As an additional option, you can run PRIMER's internal data-checking tool to find and identify certain other features that might be present in your data, including:
- Missing values,
- Negative values,
- Duplicate samples,
- Duplicate variables,
- All-zero samples,
- All-zero variables, and/or
- Estimated values
To run this routine, start by clicking on your datasheet, then click on **Tools** > **Check...**:
[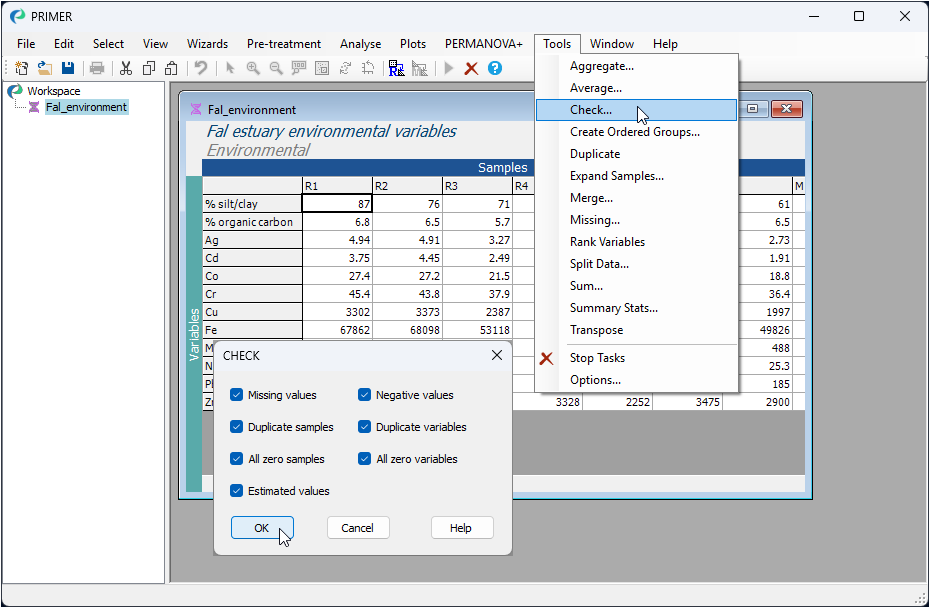](https://learninghub.primer-e.com/uploads/images/gallery/2026-02/18-tools-check-all2.png)
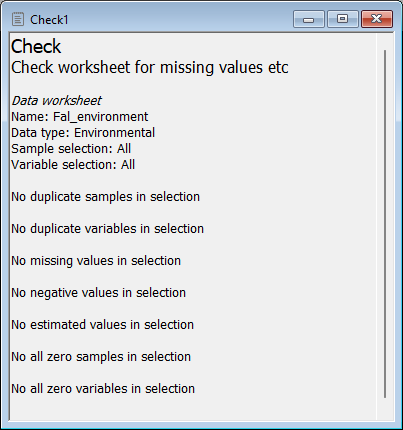
For the Fal environmental data, none of these features occurred (see below), and we are ready to proceed with subsequent analyses.
[](https://learninghub.primer-e.com/uploads/images/gallery/2026-02/19-check-data-fal-env.png)
# Save your data & workspace
#### Save your data in PRIMER (**\*.pri**) format
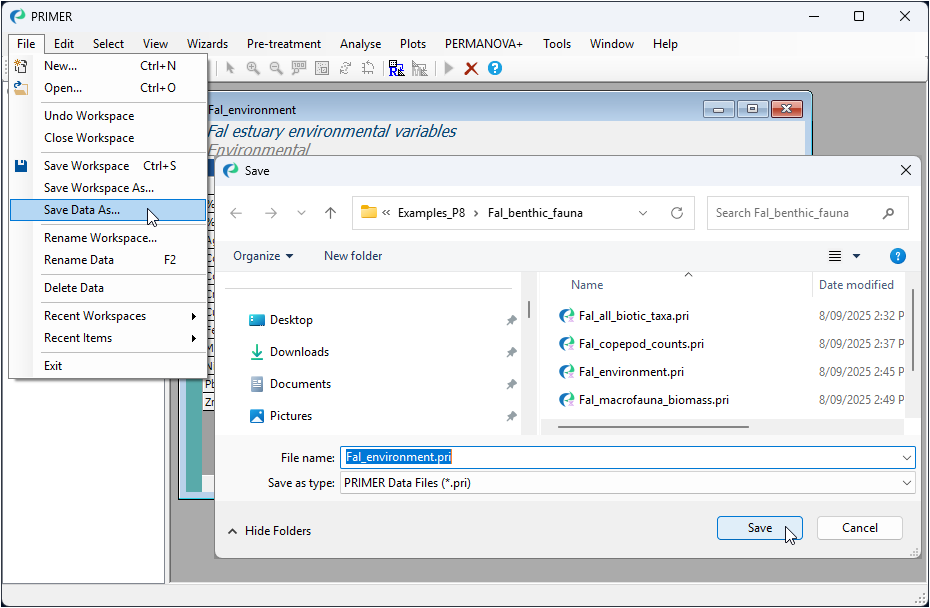
To save a data sheet in PRIMER (**\*.pri**) format, click on the data sheet in the Explorer tree inside the PRIMER workspace you want to save and click **File** > **Save Data As...**.
[](https://learninghub.primer-e.com/uploads/images/gallery/2026-02/22-save-data-as-fal-env-all.png)
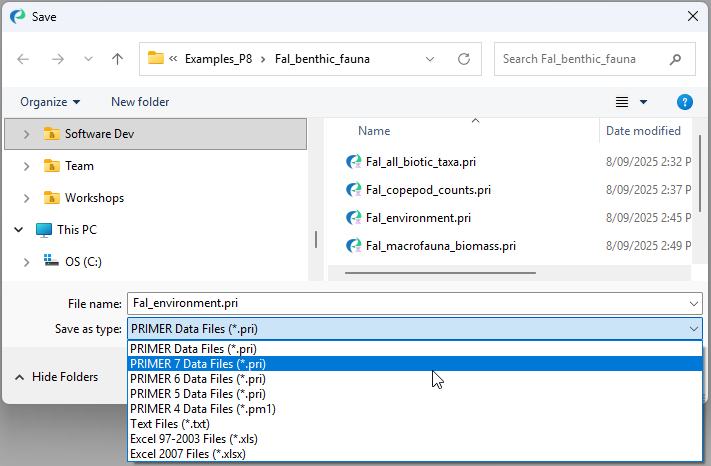
Note the default file-type for saving a data file is 'PRIMER Data Files (\*.pri)', as shown in the box labeled 'Save as type:' in the 'Save' dialog. This will save the file in ***PRIMER 8 data format***. You can change this (by clicking in the 'Save as type:' box) in order to save the data in some other format of choice, such as \*.txt, \*.csv \*.xls, \*.xlsx, or in a PRIMER data file format compatible with older versions of the PRIMER software (e.g., PRIMER 7 data format):
[](https://learninghub.primer-e.com/uploads/images/gallery/2026-02/23-save-data-in-different-format.png)
#### Save your entire PRIMER workspace (**\*.pwk**)
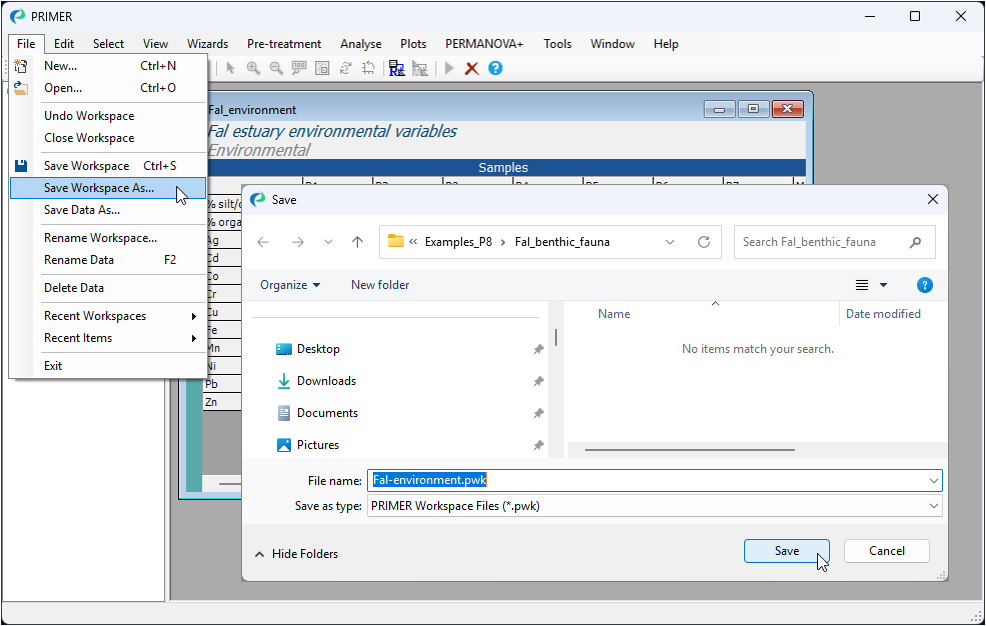
Generally, you will want to save your data ***plus*** all of the work you have done in PRIMER 8 to analyse that dataset. To save the entire PRIMER 8 workspace, click **File** > **Save Workspace As...**
[](https://learninghub.primer-e.com/uploads/images/gallery/2026-02/26-save-workspace-fal-env-all.png)
Type the name you wish to give the workspace file (e.g., Fal_environment.pwk), and click **Save**. This will save the ***entire*** PRIMER workspace (not just the data sheet), including all elements you may have created during the PRIMER session (e.g., data, graphics, analyses, etc.), all of which you are able to navigate and see listed (in hierarchical fashion) within the Explorer tree window on the left-hand side of the open PRIMER workspace.
A PRIMER workspace file is identifiable by using the file extension **\*.pwk** in the file name. Double-clicking on a file with this extension will open up that entire PRIMER workspace within the PRIMER 8 software.
The default is to save the workspace file in ***PRIMER 8 workspace format***. You can change this (by clicking in the 'Save as type:' box) in order to save the workspace in a format compatible with older versions of the PRIMER software, i.e., either PRIMER 7 or PRIMER 6 (versions earlier that PRIMER 6 did not have a workspace). Be aware, however, that some of the graphical elements that are new to PRIMER 8 (e.g., Violin plots, Dot plots, etc.) may not appear when the workspace is saved to older file types.