# Step 1: Data selection
#### Open up the example data file
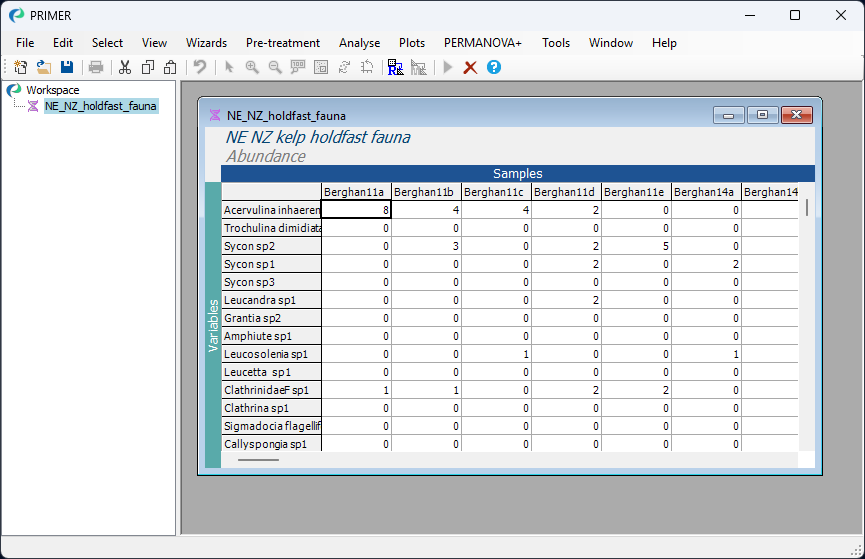
Launch PRIMER, then click **File** > **Open...** from the main menu, navigate to the folder named 'NE_NZ_holdfasts' in the 'Examples_P8' directory, and select 'NE_NZ_holdfast_fauna.pri'. Click **Open** to display the species matrix.
[](https://learninghub.primer-e.com/uploads/images/gallery/2026-02/01-holdfast-data.png)
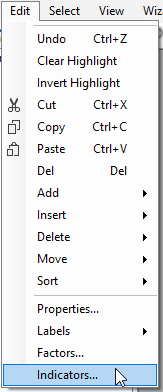
Click on **Edit** > **Indicators...**
[](https://learninghub.primer-e.com/uploads/images/gallery/2026-02/02a-edit-indicators-menu.png)
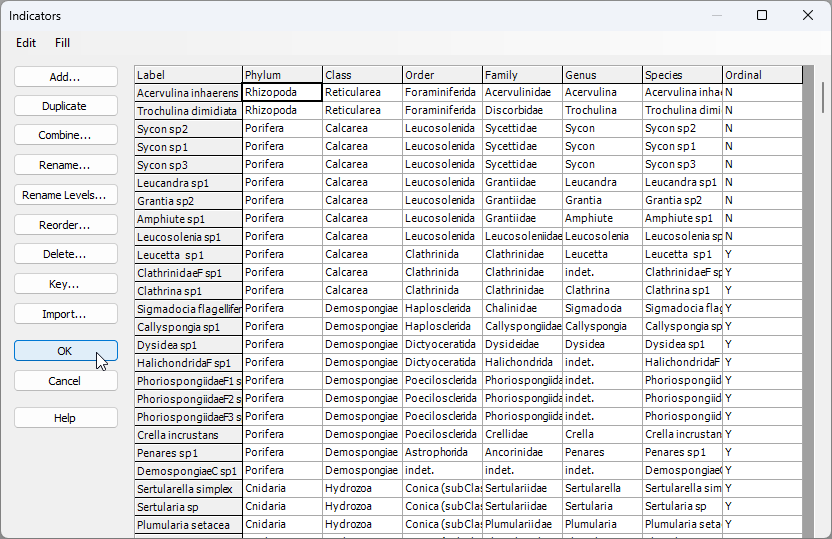
You will see that there are indicators for the variables in this datasheet that show the taxonomic groups in which each species (or taxon) variable belongs, with different levels of the taxonomic hierarchy being provided as different indicators (i.e., 'Genus', 'Family', 'Order', 'Class' and 'Phylum'). There is also an indicator to identify whether individual taxa were counted (enumerated) or quantified on an ordinal scale ('Ordinal' = 'N' or 'Y', respectively).
[](https://learninghub.primer-e.com/uploads/images/gallery/2026-02/02-edit-indicators.png)
Click **OK** on the 'Indicators' dialog, so the data matrix is the active item in the workspace again.
#### Select a subset of variables, using an indicator
We wish to select just the mollusc species for the analysis.
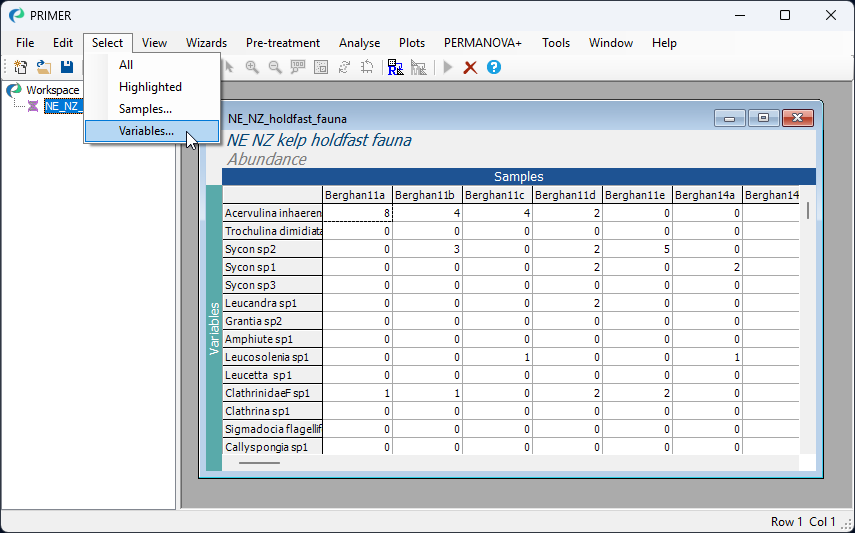
1. From the 'NE_NZ_holdfast_fauna.pri' data sheet, click **Select** > **Variables...**
[](https://learninghub.primer-e.com/uploads/images/gallery/2026-02/03-select-variables-menu-item.png)
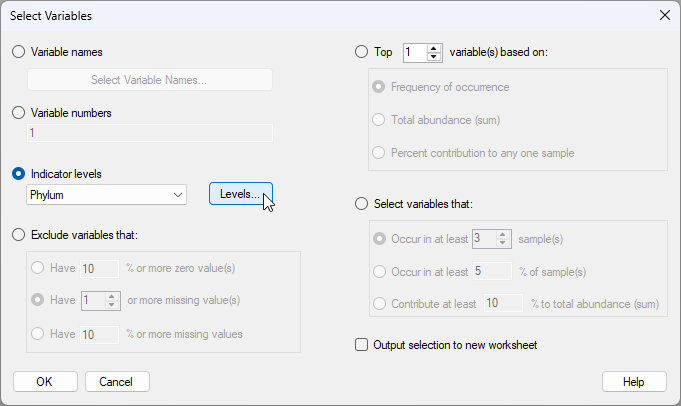
2. In the 'Select Variables' dialog, choose ($\bullet$Indicator levels > Phylum) and click **Levels...**.
[](https://learninghub.primer-e.com/uploads/images/gallery/2026-02/04-select-variables-dialog.png)
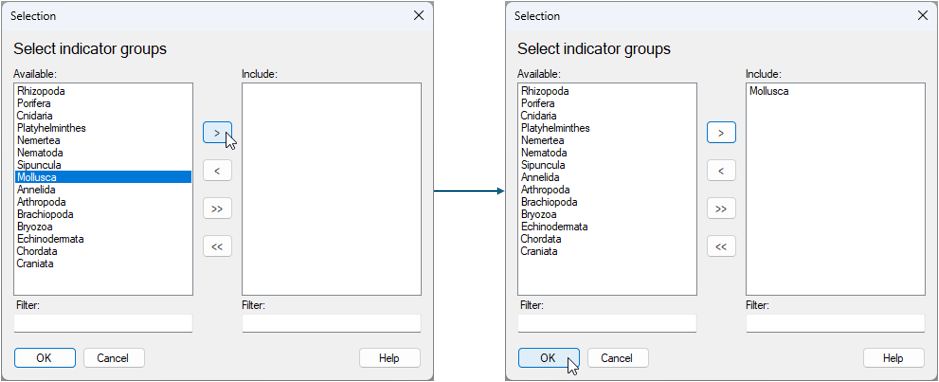
3. In the 'Selection' dialog, click on the word 'Mollusca' in the list of 'Available' phylum categories, and click on the single-right-arrow button: [](https://learninghub.primer-e.com/uploads/images/gallery/2026-02/05-right-arrow.png). This will move the word 'Mollusca' over to the 'Include:' box on the right-hand side of the 'Selection' dialog window. Click **OK**.
[](https://learninghub.primer-e.com/uploads/images/gallery/2026-02/05-selection-window-all.png)
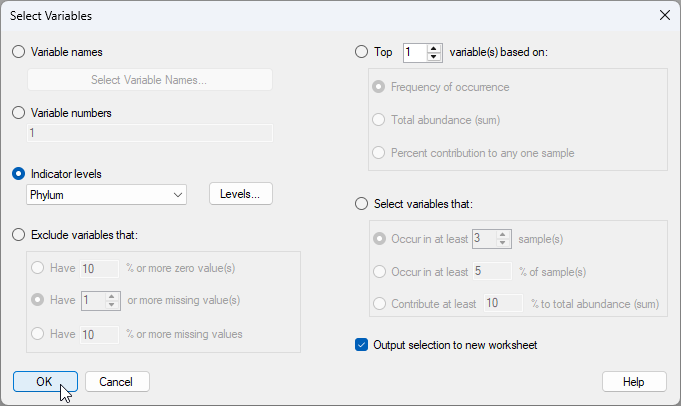
4. Now that we have selected the Molluscs, and we are back in the 'Select Variables' dialog window, we ***also*** want to choose to '$\checkmark$ Output selection to new worksheet', as shown below. This will kick out just the variables that we have selected into a new worksheet for ensuing analysis. We can now click **OK** on the 'Select Variables' dialog.
[](https://learninghub.primer-e.com/uploads/images/gallery/2026-02/05b-output-to-new-worksheet.png)
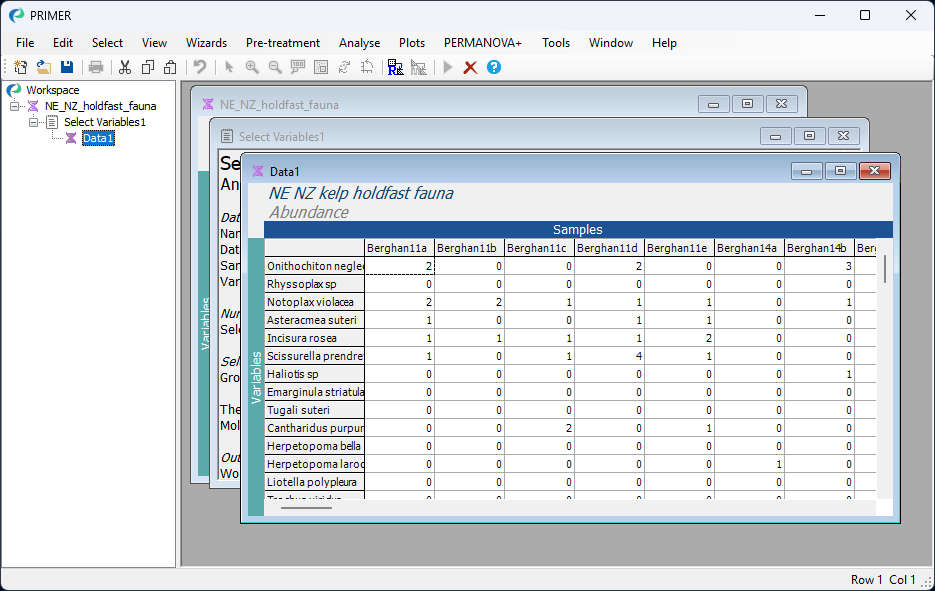
Voila! Now you have just the mollusc species alone in a new worksheet called 'Data1'¶.
[](https://learninghub.primer-e.com/uploads/images/gallery/2026-02/05c-subsetted-data-molluscs.png)
#### Rename the selected subset of data
From the subsetted data matrix ('Data1'), if you click on **Edit** > **Properties...**, you will see that this new sheet now only has 105 variables ('Number of rows:').
To change the name of the data sheet, click, hover and click again on the name 'Data1' in the Explorer tree window (*or* click **File** > **Rename Data** *or* hit the 'F2' key) and type in a new name for the subsetted data sheet: Molluscs.
[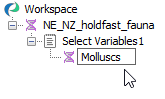](https://learninghub.primer-e.com/uploads/images/gallery/2026-02/07-explorer-tree-change-name.png)
At this point, you might like to save your workspace. Click **File** > **Save Workspace As...** > (Filename: NZ_holdfast_molluscs.pwk).
----
¶ ***An aside**: Note that whenever you have selected a subset of data (this might be a subset of variables, as done here, or a subset of samples, or both), then the original data matrix on which the operation has been done will have a blue background colour to indicate that you have done this, like so:*
[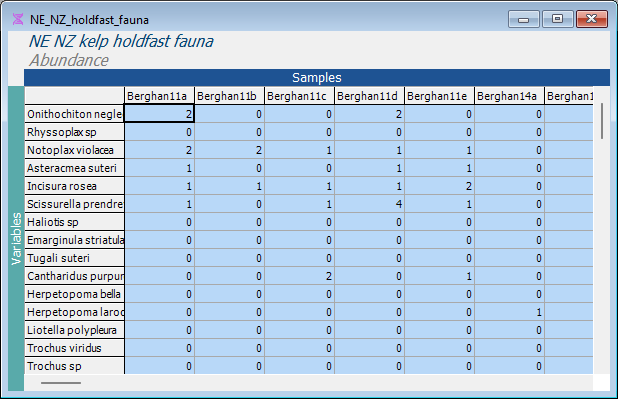](https://learninghub.primer-e.com/uploads/images/gallery/2026-02/06-selected-data-in-blue-hf.png)
*Any analyses done on a selected subset of data will only be performed on that subset. It is usually a good idea to **duplicate and rename** a selected subset of data, so as to keep any analysis done on that subset of data clear and separate from the (full) original dataset. To duplicate an item in the Explorer tree, click **Tools** > **Duplicate**. To rename the duplicated item, hit F2 (or click **File** > **Rename Data**).*
*Note that subsetting does not affect the original full data matrix of information in any way, which is still always there. You can clear any subset selection (of variables and/or samples) by clicking on **Select** > **All** to return to the full data matrix in its entirety. The blue background colour will go away when you do that, and the formerly selected data will yet be highlighted in yellow-orange hues.*
[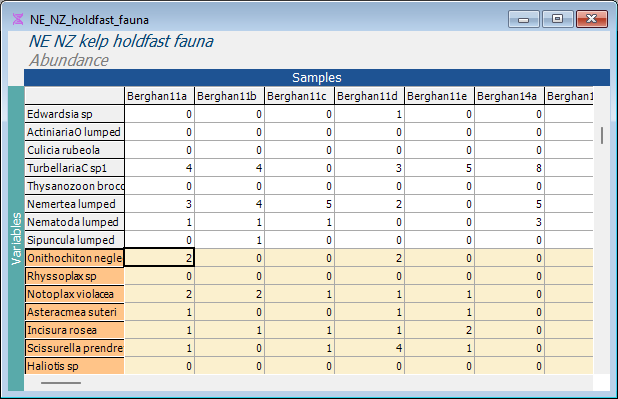](https://learninghub.primer-e.com/uploads/images/gallery/2026-02/06-highlighted-data-orange-hf.png)
*Clicking on **Select** > **Highlighted** can then be used to re-instate the selection from before, if desired.*