# Step 4: Run PERMANOVA
Once the design file is created, we are ready to go ahead with the PERMANOVA analysis.
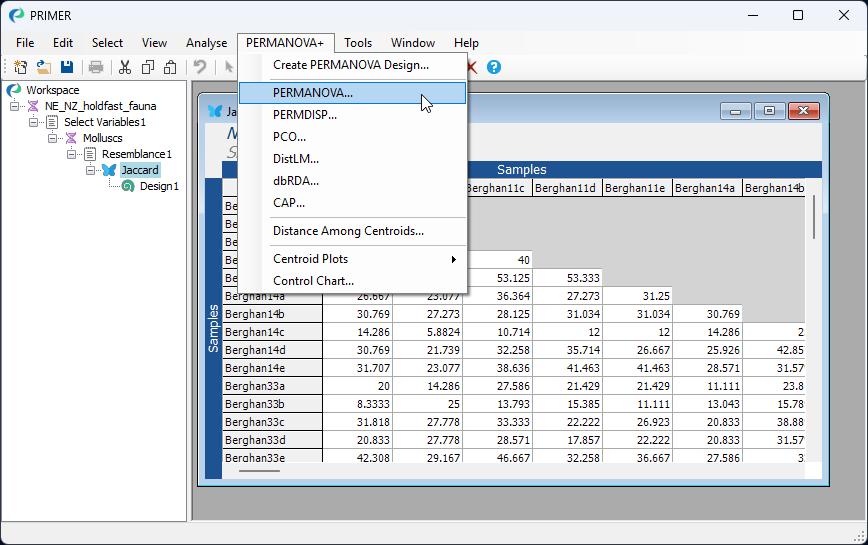
1. Click on the 'Jaccard' resemblance matrix in the Explorer tree so that it is the active item in the workspace, then click **PERMANOVA+** > **PERMANOVA...**
[](https://learninghub.primer-e.com/uploads/images/gallery/2026-02/20-permanova-menu.png)
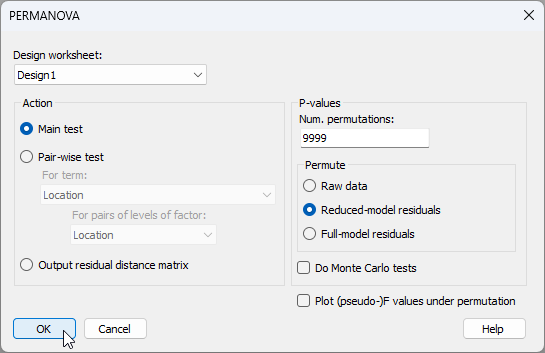
2. Check to see that the 'Design worksheet:' is Design1; this is the design file we created in the previous step that contains the three-way nested design. For the rest, we will keep the defaults in the PERMANOVA dialog, as shown below, then click **OK**.
[](https://learninghub.primer-e.com/uploads/images/gallery/2026-02/21-permanova-dialog.png)
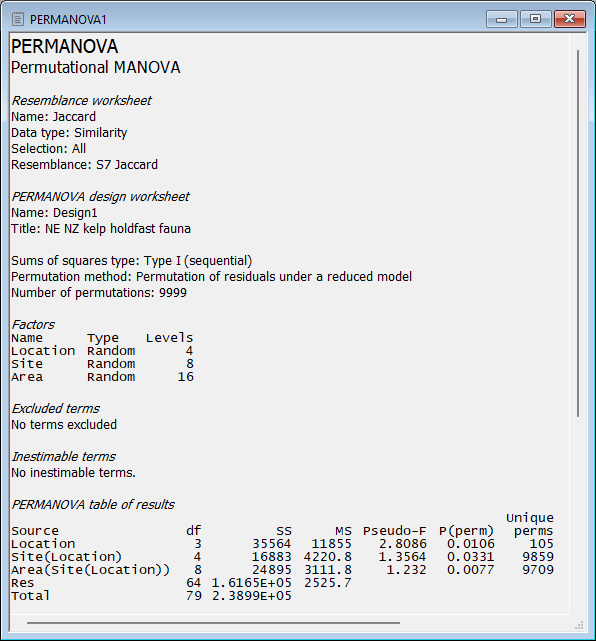
3. This produces an output file (called 'PERMANOVA1') in the Explorer tree. It shows:
- the details of the choices you made in the PERMANOVA dialog to run the analysis;
- the details of your experimental design; and
- the PERMANOVA table of results
as follows:
[](https://learninghub.primer-e.com/uploads/images/gallery/2026-02/22-permanova-results-file-hf.png)
#### Interpretation
These results show that there is statistically significant variability in the identities of molluscs among holdfasts at each of the three spatial scales in the experimental design: **Areas** ($F_{8,64}$ = 1.23, $P$ < 0.01), **Sites** ($F_{4,8}$ = 1.36, $P$ < 0.05) and **Locations** ($F_{3,4}$ = 2.81, $P$ < 0.05). Note that the p-value for Locations is somewhat limited by the number of unique values of the pseudo-F statistic under permutation that are available here. Specifically, when we permute 2 samples per group (i.e., the 8 Sites) randomly across 4 groups (the Locations), there are just 105 unique values of pseudo-F that can be obtained, so the minimum possible p-value here is 1/105 = 0.0095).