Introduction and overview
- 0.1 Title page
- 0.2 Contact details and installation of the PERMANOVA+ software
- 0.3 Introduction to the methods of PERMANOVA+
- 0.4 Changes from DOS to PERMANOVA+ for PRIMER
- 0.5 Using this manual
0.1 Title page
0.2 Contact details and installation of the PERMANOVA+ software
Getting in touch with us
PERMANOVA+ for PRIMER was produced as a collaborative effort between Professor Marti Anderson (New Zealand Institute for Advanced Studies, Massey University, Albany, Auckland, New Zealand and current Director of PRIMER-e) and Ray Gorley & Professor Bob Clarke (formerly of PRIMER-E Ltd, Plymouth, UK). For the latest news about PERMANOVA+ or PRIMER, including details of upcoming training workshops, see: http://www.primer-e.com
Please report any bugs, technical problems, dislikes or suggestions for improvement to: tech@primer-e.com. For licensing and other general enquiries, contact Lyn Shave at: primer@primer-e.com. For queries related to the scientific methods, contact Marti Anderson at: marti@primer-e.com.
Our business postal address is:
PRIMER-E Ltd" PRIMER-e (Quest Research Limited)
ecentre, Gate 5, Oaklands Rd
Massey University Albany Campus
Auckland 0632
New Zealand
Tel: +64 (0)9 869 2230
(or you may, if you prefer, use the registered address of the company: PRIMER-e (Quest Research Limited), 67 Mahoenui Valley Rd, RD3 Albany, Auckland 0793, New Zealand).
System requirements
PERMANOVA+ is an add-on package to the PRIMER v6 software program. PERMANOVA+ is not a stand-alone piece of software and can only be installed on machines that already have PRIMER v6 installed. Other requirements, in accordance with PRIMER v6, are:
- PC with Intel compatible processor.
- Windows 2000/XP/Vista or later, 32 and 64 bit.
- Memory - For Windows 2000 and XP: 128 Mb (256 Mb recommended). For Windows Vista or later: 512 Mb (1Gb recommended).
- Internet Explorer 5.01 or later is needed to install the .Net framework.
- To be able to read and write Excel worksheets you need Excel 2000, or later, installed.
Installing PERMANOVA+
Ensure that PRIMER v6 is installed before installing PERMANOVA+. PERMANOVA+ is an add-on product for installation on an individual PC, not a network server. You need to be logged on as an Administrator. The procedure is the same if you have an earlier version of PERMANOVA+ installed (e.g., a beta-test version). Note that this add-on package will not work with earlier versions of PRIMER (e.g., v5).
Insert the PERMANOVA+ CD in your CD drive. The install program will automatically run unless you have disabled AutoPlay on your drive. (If it does not run, open Windows Explorer, right click on the CD drive and select the ‘Install’ or ‘AutoPlay’ option.) The install program may first install or update the .Net framework. You will be asked for your serial number which is on the front of the PERMANOVA+ CD case. Setup may reboot your system during the installation and, as usual, it is advisable to close down all other programs before commencing installation.
Getting help
This manual assumes that the user already has familiarity with the general features of PRIMER v6. Important information regarding the use of PRIMER v6 is given in the two manuals accompanying that software: a methods manual (
Clarke & Warwick (2001)
) and a user manual/tutorial (
Clarke & Gorley (2006)
). Information specific to PERMANOVA+ is contained in this manual and the software Help system. The latter is context sensitive: if you click on the Help button in a dialog box then you will get an appropriate help topic. You can also get into the help system by choosing the Help menu option or clicking on the help button  on the Tool bar. You can then browse this system via the Contents or Index tabs in the Help window. If you are still having problems, contact us (see the top of this page), and we will be happy to help.
0.3 Introduction to the methods of PERMANOVA+
Rationale
PERMANOVA+ is an add-on package which extends the resemblance-based methods of PRIMER to allow the analysis of multivariate (or univariate) data in the context of more complex sampling structures, experimental designs and models. The primary reasons that the methods currently available in the PRIMER package (such as ANOSIM and MDS) have become so widely used for the analysis of multivariate ecological (and other) data are their general robustness and flexibility. They are flexible due to their reliance, at heart, on a resemblance measure (a distance, dissimilarity or similarity), of which there are many to choose from, each with its own emphasis and properties. They are robust because, unlike traditional multivariate statistical methods, they make no explicit assumptions regarding the distributions of original variables, acting primarily only on the ranks of dissimilarities, and with any hypothesis-testing procedures (such as ANOSIM) using permutations to obtain P-values. The philosophy underlying the methods in PRIMER, as articulated by Clarke & Green (1988) and Clarke (1993) , is to maintain this purely non-parametric rank-based approach throughout. This is generally highly appropriate, because most ecological data (being counts or other measures of abundances of species) tend to be overdispersed, with heavily right-skewed distributions ( Taylor (1961) , Seber (1982) , McArdle, Gaston & Lawton (1990) ) and a plethora of zeros ( Welsh, Cunningham, Donnelly et al. (1996) , Fletcher, Mackenzie & Villouta (2005) ). Also, the number of variables (usually species or taxa) often far exceeds the number of sampling units (quadrats, cores, transects, etc.), making traditional statistical approaches either problematic or simply impossible (e.g., as in MANOVA). Even if the number of variables does not exceed the number of samples, traditional MANOVA (unlike univariate ANOVA) is not robust to violations of its assumptions, especially multivariate normality (e.g., Mardia (1971) , Olson (1974) , Johnson & Field (1993) ).
By taking a purely non-parametric approach, however, one must also accept certain limitations. Perhaps the most important of these is the lack of any ability to partition the multivariate variation according to more complex experimental designs. More particularly, a purely non-parametric approach precludes us from: (i) partitioning variability according to one or more explanatory variables or factors; (ii) measuring or testing interactions among factors (which can only be defined by reference to main effects that have been modelled in some way); and (iii) developing explicitly quantitative models with any explanatory, discriminatory or predictive uses. Most ecological experiments, whether they be mensurative or manipulative (sensu Hurlbert (1984) ), do have complex sampling structures, with multiple hierarchical spatial and/or temporal scales. Few scientists embark on experiments having only one factor; experimental designs with more than one factor, including interactions, are far more common, being more efficient, informative and relevant ( Underwood (1981) , Underwood (1997) ). In addition, tests of interactions are used to examine the generality of phenomena (in time or space, e.g., Snedecor (1946) , Beck (1997) ) and to assess environmental impact with rigour (e.g., Green (1979) , Underwood (1991) , Underwood (1992) ).
The purpose of the routines provided in the PERMANOVA+ add-on package is to maintain as much of the flexibility and robustness inherent in the methods offered by PRIMER as possible, yet to achieve the partitioning required to analyse more complex designs and to develop multivariate models. In essence, the methods in PERMANOVA+ allow multivariate data to be modelled, analysed and tested on the basis of any resemblance measure of choice, and all tests of hypotheses are done using permutation techniques1. The methods offered as part of the PERMANOVA+ add-on package do not in any way replace the existing methods in PRIMER, but rather, they provide a complementary set of tools for more complex designs and modelling. Unfortunately, you can’t get something for nothing, and so in order to take this step of partitioning, we must articulate what we mean by “variation” and, in so doing, give up the “purely non-parametric” label. In other words, we will allow the actual values in the resemblance matrix to take on meaning; they will not be replaced by their relative ranks; we will allow the chosen resemblance measure for a given analysis to dictate what we mean by “multivariate variability”. This is not too much of a tragedy, as we do still retain great flexibility (because we can still choose any resemblance measure we wish) and robustness (because permutation methods are being used)2. What it does mean, however, is that we will need to think carefully about the meaning of the resemblance measure we do choose to use (including any transformations) as this choice will play an even more important role in the analysis than is the case in other PRIMER routines.
Application
As in PRIMER, the focus of PERMANOVA+ is generally on the analysis of ecological data, especially counts of species abundances. In addition, many of the data sets and examples are from ecology, particularly from marine or estuarine ecosystems, due to the origins of the methods arising from these contexts. However, the methods themselves are not limited, and may be applied to any situation where one wishes to analyse either univariate or multivariate data in response to either simple or complex experimental designs or models. The methods are particularly suited to the analysis of data which do not fulfil the assumptions of traditional statistical approaches because they have too many response variables, or because one or more response variables are not normally distributed. In general, the only requirement of the permutation-based techniques in any of these routines is that either the samples (observation units) themselves or the errors under a particular model be exchangeable under an appropriate null hypothesis.
A search of the ISI database of articles that have cited some of the core methods papers (e.g., Anderson (2001a) , McArdle & Anderson (2001) , Anderson & Willis (2003) ) gives a good indication of the types and variety of recent applications of these techniques. They include not only ecological examples from marine, freshwater and terrestrial environments, but also examples from diverse disciplines such as zoology (e.g., Pertoldi, Garcia-Perea, Godoy et al. (2006) ), soil science (e.g., Hoyle & Murphy (2006) ), genetics (e.g., Wessel & Schork (2006) ), psychology (e.g., Wheldon, Anderson & Johnson (2007) ) and physiology (e.g., Hepner, Homewood & Taylor (2002) ).
Individual details for each method are given in separate chapters, but as a general point of interest, when the methods are applied to a Euclidean distance matrix, they are equivalent to their traditional statistical counterparts (e.g., ANOVA, regression, PCA, RDA, discriminant analysis, etc.). This means that any data set for which a traditional statistical method would be appropriate can be analysed using the routines in PERMANOVA+, but with more robust statistical inferences provided by virtue of the use of permutations, rather than tables, to obtain P-values.
Outline of routines
Virtually all of the methods provided in the PERMANOVA+ add-on package for PRIMER begin with the resemblance matrix. The first time the user opens up PRIMER after installation of the add-on, a new menu item will appear (Fig. B.1), called PERMANOVA+, from which all of the individual routines can be accessed once a resemblance matrix has been either imported or created within PRIMER.
The individual routines are:
PERMANOVA, for the analysis of univariate or multivariate data in response to factors, groups or treatments in an experimental design;
PERMDISP, to measure and test homogeneity of multivariate dispersions among a priori groups;
PCO, to provide an unconstrained ordination of multivariate data on the basis of a chosen resemblance measure;
DISTLM, for the analysis of univariate or multivariate data in response to continuous (or categorical) predictor variables (such as environmental variables), a distance-based regression approach, with various options for model selection;
dbRDA, for the ordination and visualisation of fitted models (such as from DISTLM); and
CAP, to use multivariate data to discriminate among a priori groups or to predict values along a gradient; also to do distance-based canonical correlation.
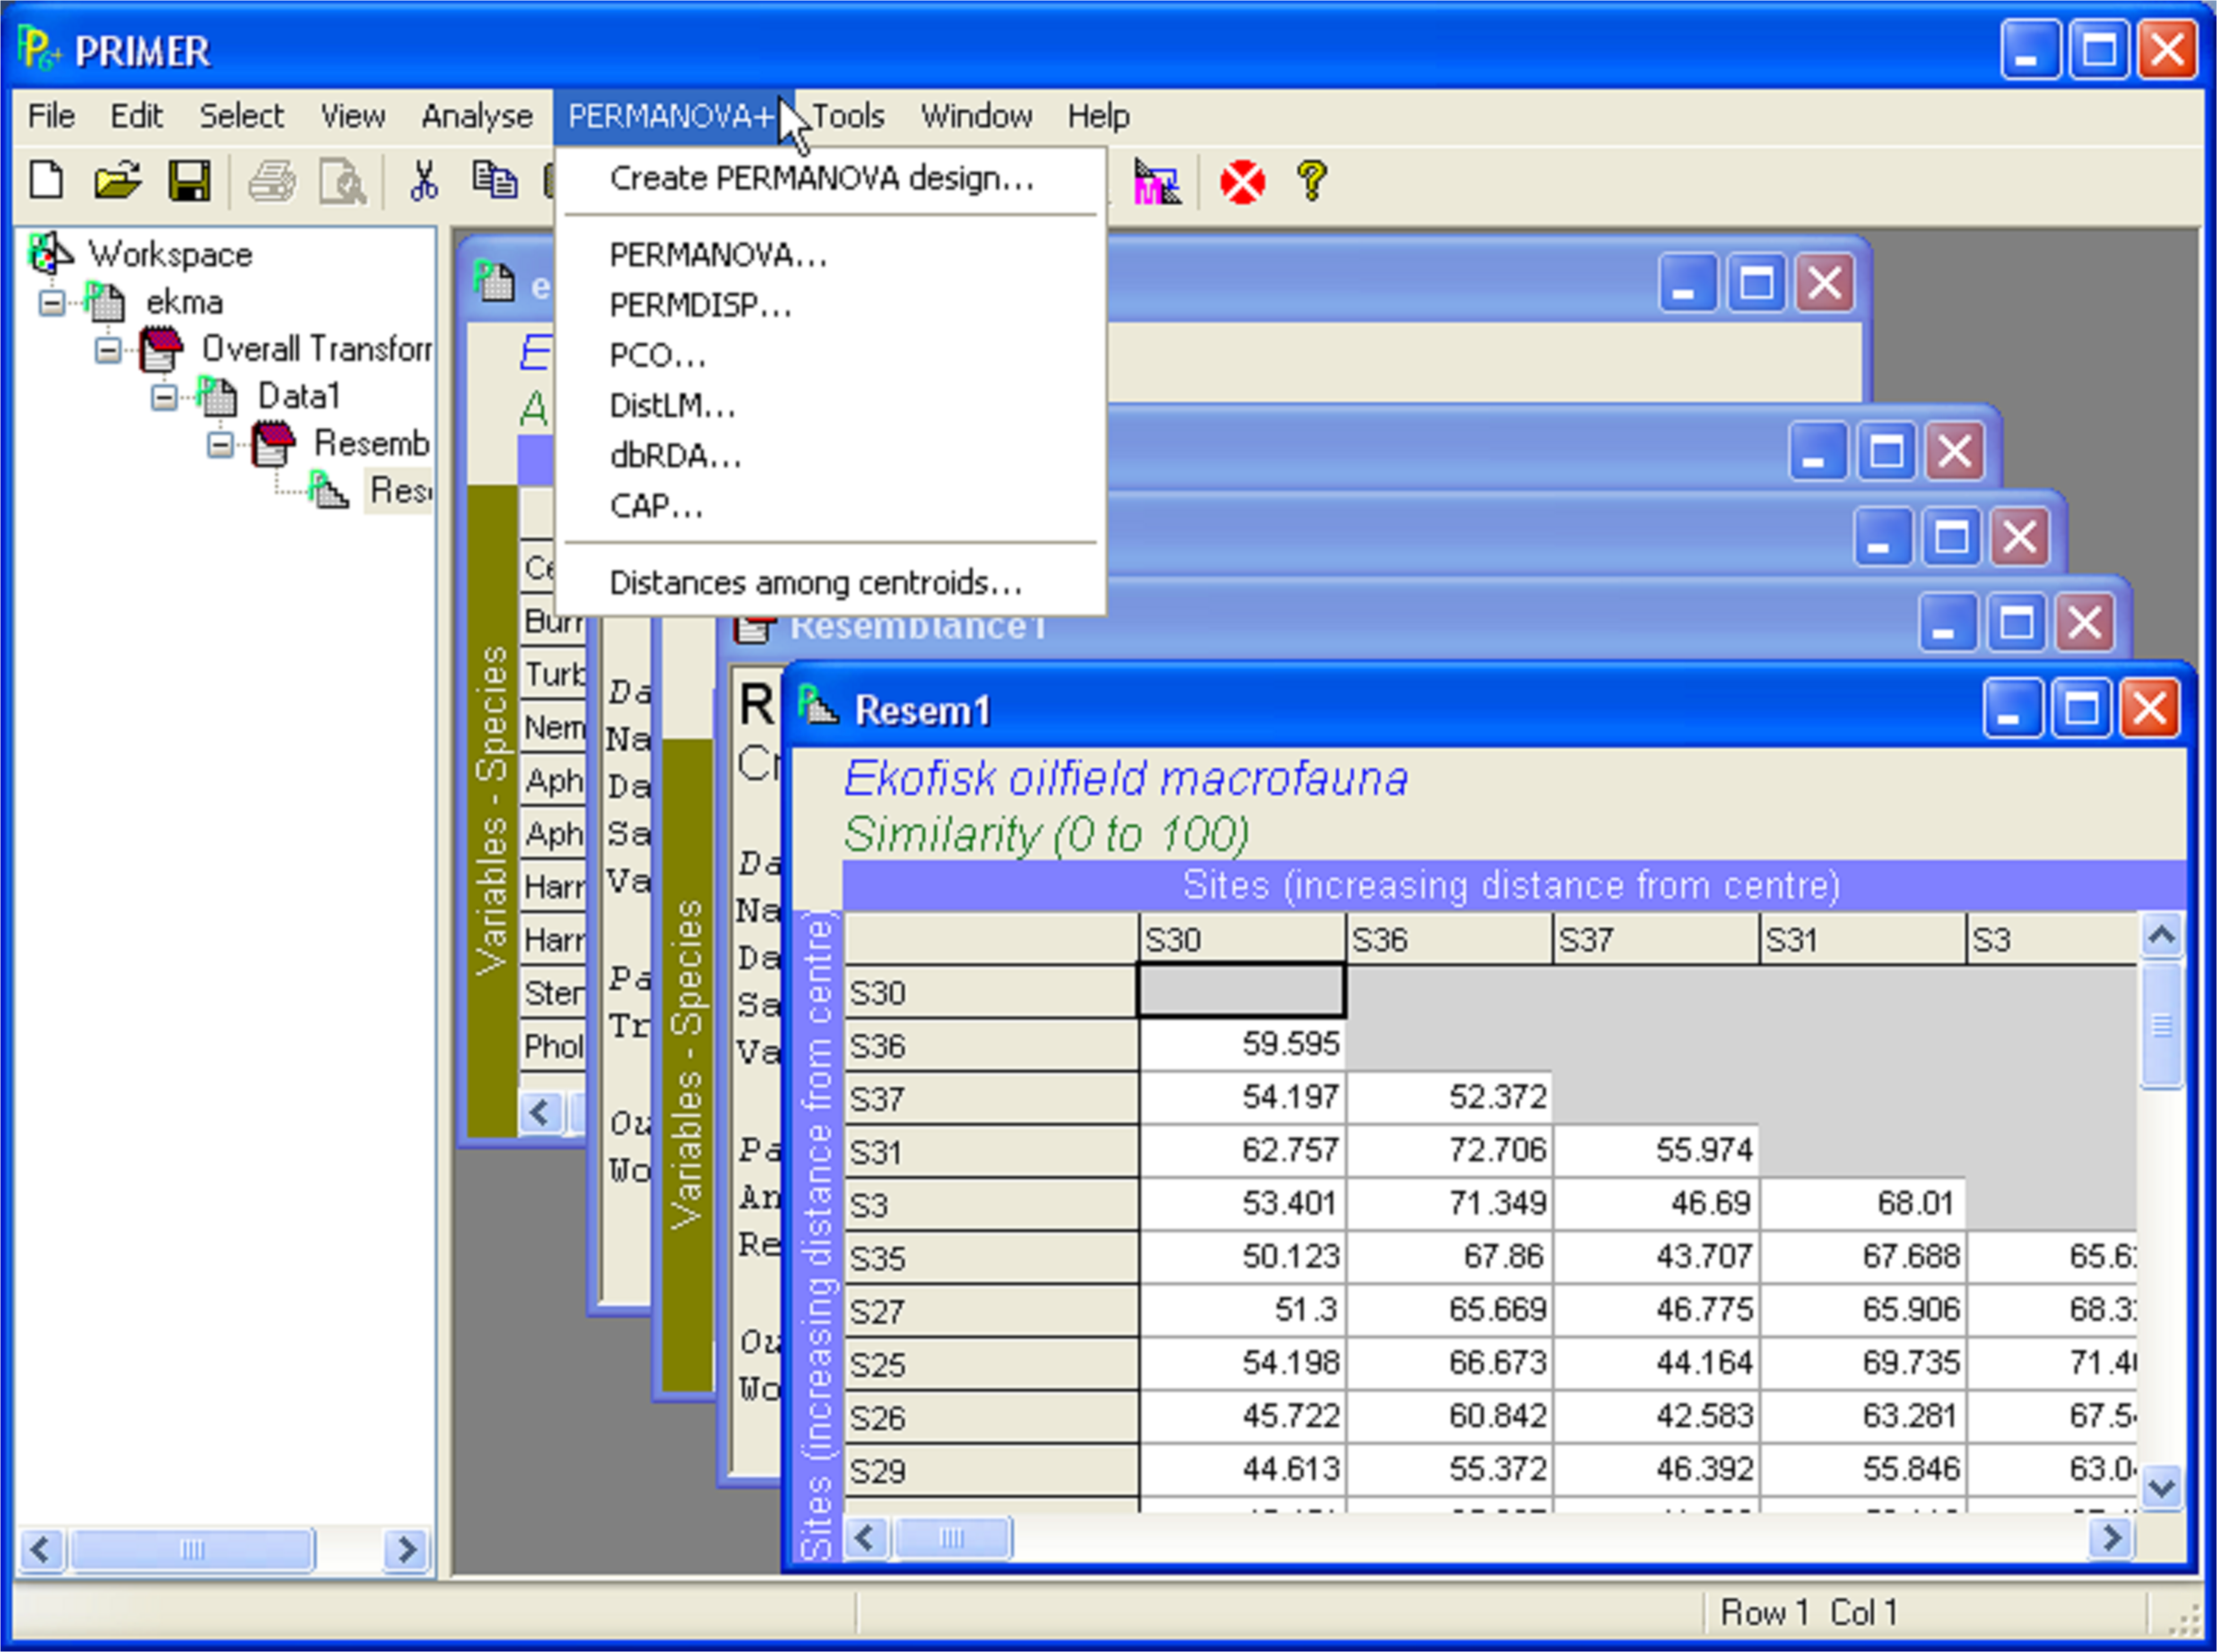 Fig. B.1. The new menu item for the PERMANOVA+ add-on to PRIMER v6.
Fig. B.2 shows a schematic diagram and flowchart of the routines in the context of their use. Alongside each method (inside an oval shape) is also shown the corresponding traditional statistical method that would be obtained in the event that the resemblance matrix used to begin with contained Euclidean distances. The diagram does not show all of the many other routines available from within PRIMER, which are well described elsewhere (
Clarke & Gorley (2006)
). Many of these may be used in combination with the routines offered in PERMANOVA+. For example, in the absence of a priori groups, PRIMER routines such as CLUSTER and the associated SIMPROF tests may be appropriate, and the use of exploratory tools, such as draftsman plots, to examine distributions and potential multicollinearity among predictor variables, are also highly recommended before proceeding with modelling (Fig. B.2).
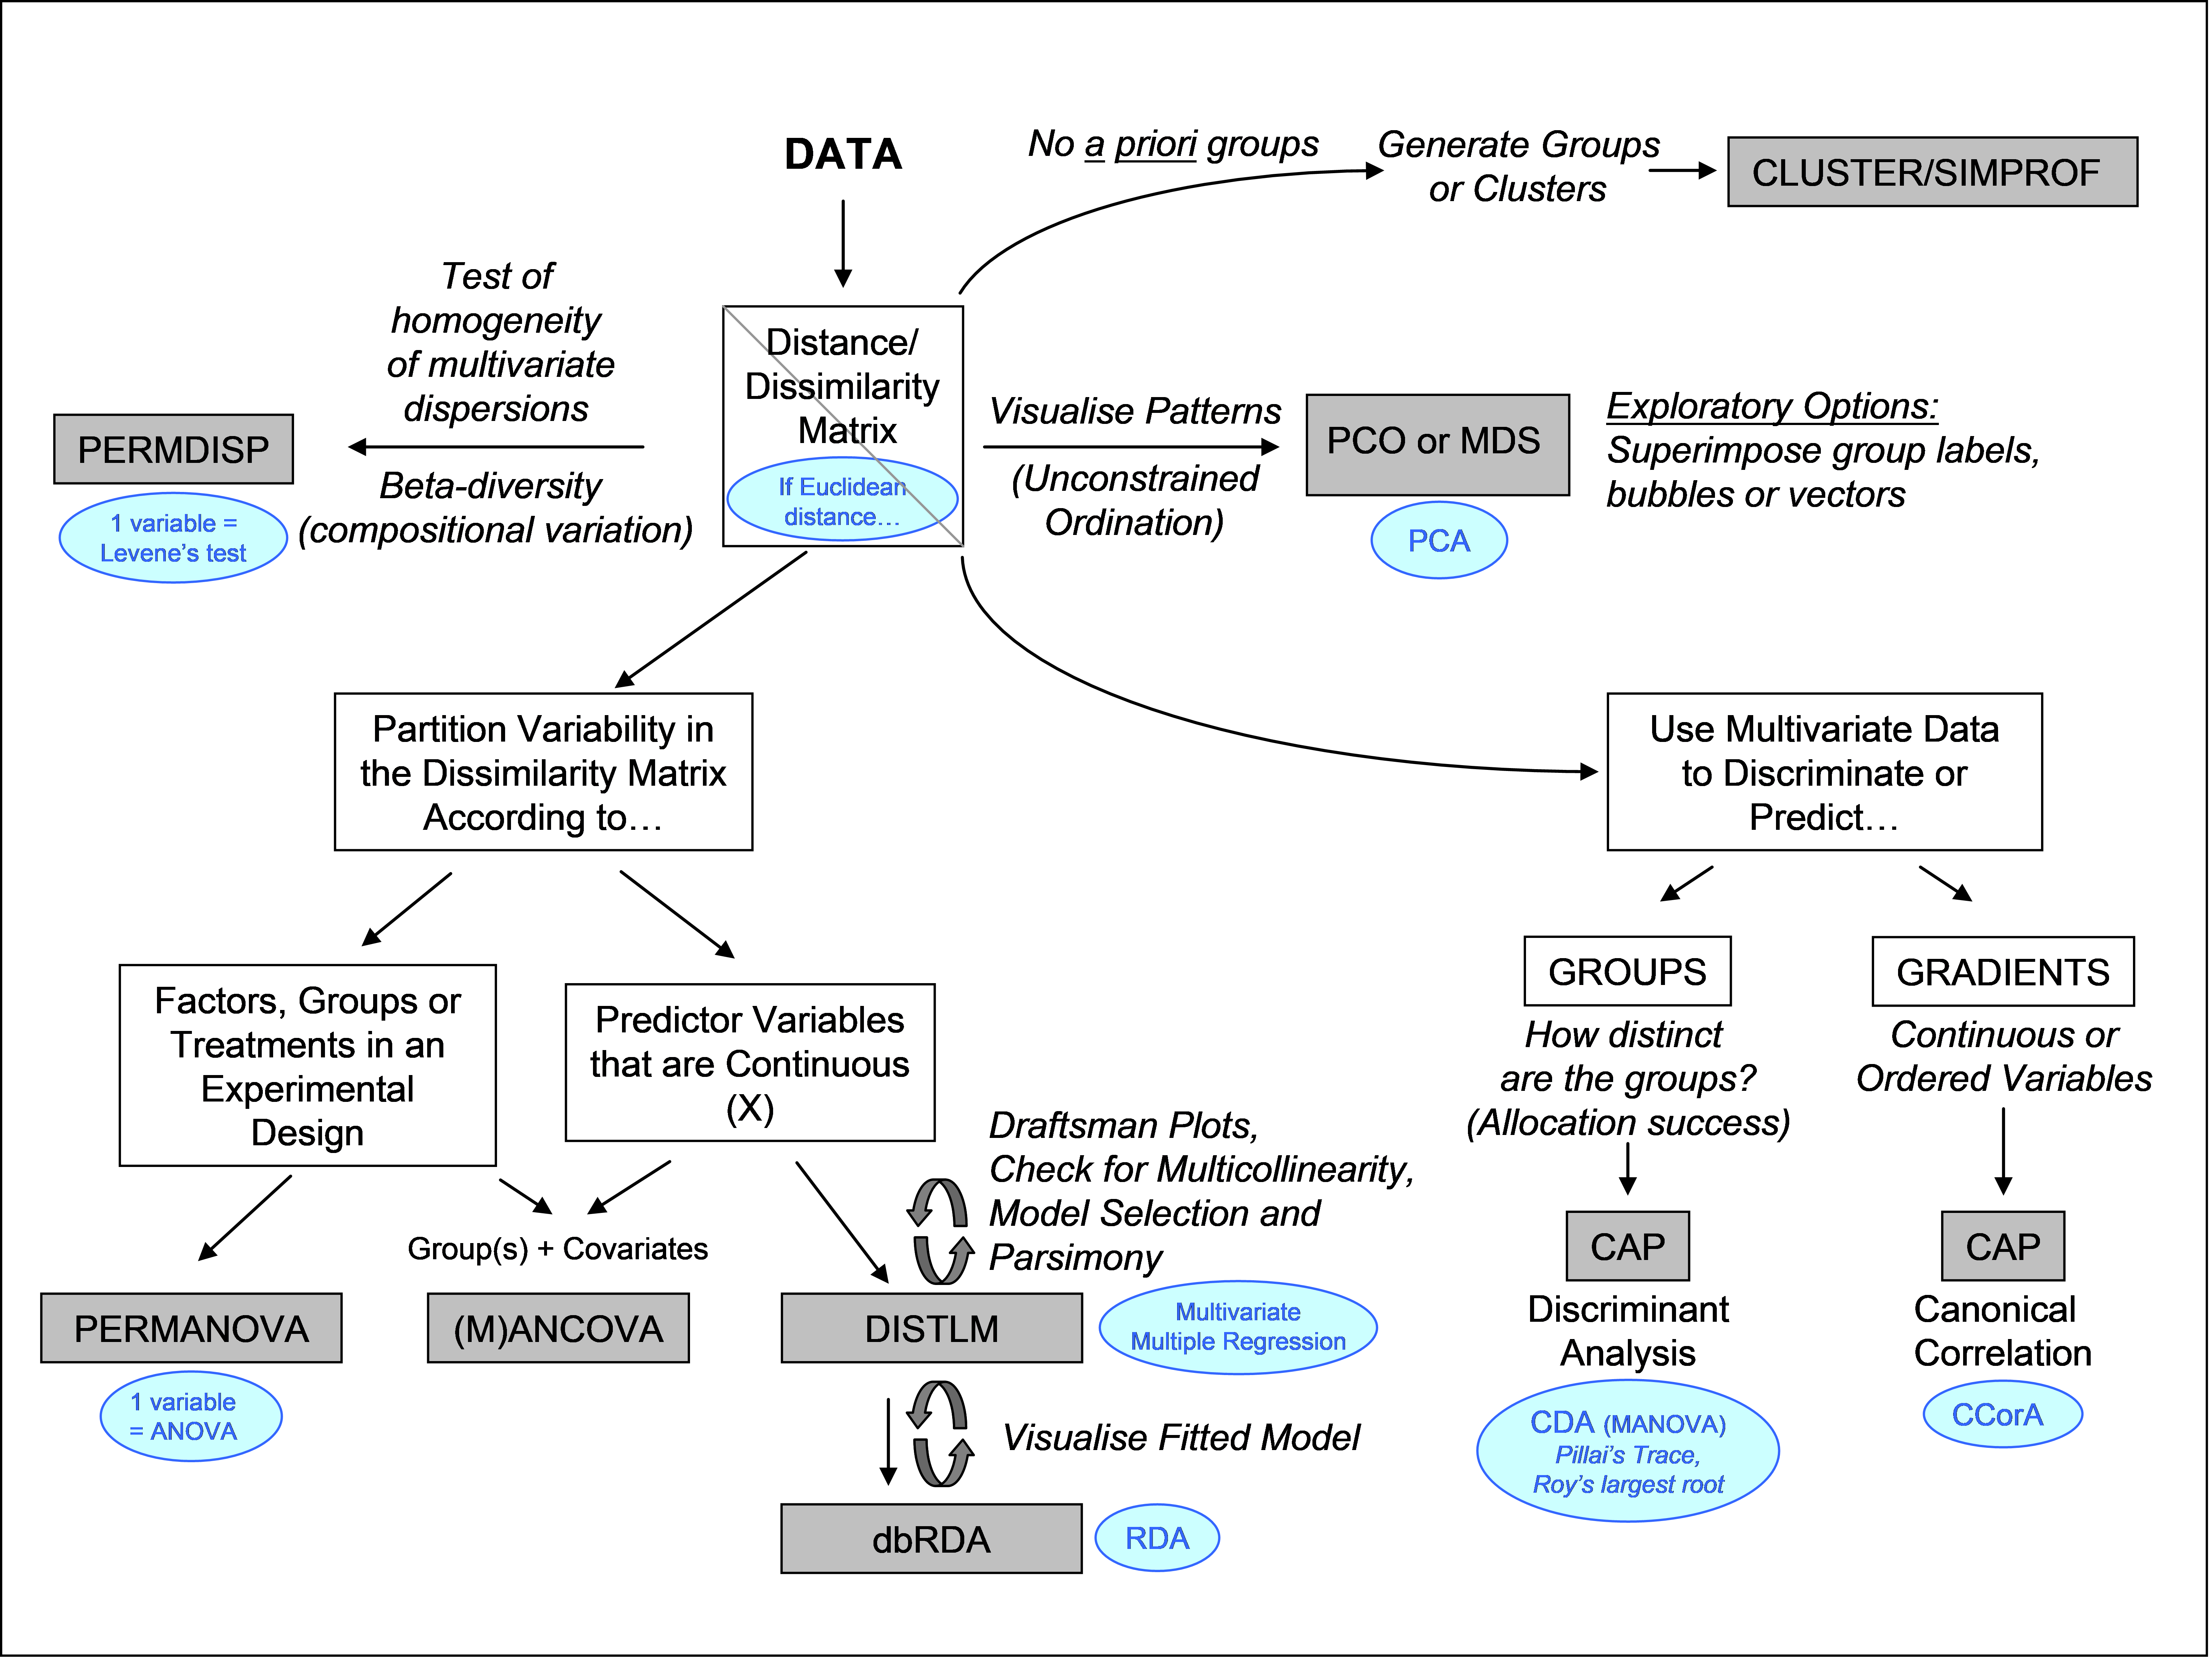 Fig. B.2. Schematic flowchart showing the methods in PERMANOVA+ and their traditional counterparts (in ovals), obtained if Euclidean distances are used.
1 Exceptions to this include: (i) the option to do Monte Carlo sampling from an asymptotic permutation distribution, in the event of there being too few possible permutations for a meaningful test in PERMANOVA and (ii) the option to use tabled F distributions in PERMDISP.
2 Although the methods offered by the PERMANOVA+ package may not be purely non-parametric, they still make no explicit assumptions regarding either the distribution of the original variables or of the resemblance values themselves, as a consequence of their use of permutation techniques. The methods may be considered, therefore, to be “semi-parametric” in some sense.
0.4 Changes from DOS to PERMANOVA+ for PRIMER
The new Windows interface
-
All of the original DOS routines have been fully re-written, translated from their original FORTRAN into the new Microsoft .NET environment, as used by PRIMER v6. This gives the software a fully modern Windows user interface.
-
The integration of the add-on package with the current PRIMER v6 is seamless and complete, with true multi-tasking, providing a greatly enhanced ability to both visualise and formally analyse multivariate data from within a single package.
-
There are no fixed size constraints on data matrices, the number of factors, or group sizes for any analysis. The limitations are imposed only by the total available memory.
-
Other major advantages of PRIMER v6 shared by the PERMANOVA+ add-on include: workspaces and explorer tree navigation; multiple input formats (including from Excel, or 3-column format); label matching (avoiding the need to worry about the order of data in worksheets, provided the labels used are consistent); data handling operations (sorting, ranking, merging, transforming, summing, etc.); easy cutting and pasting of text results or graphics; multiple output formats (.txt, .rtf, .xls, .jpg, .tif, .emf, etc.); factors on samples (or indicators on variables) can be read in from (or saved to) Excel or text formats along with the data; data can be averaged or summed according to factor levels or combinations of them; levels of multiple factors can be identified with symbols and labels on enhanced 2-d and 3-d plots. Importantly, the package offers a great range of pre-treatment transformations or standardisations, as well as the additional choice of more than 50 resemblance measures.
Development of the methods
-
The new PERMANOVA routine can now be used to analyse any balanced or unbalanced experimental design, either with or without covariables, for fixed, random or mixed models, either with or without hierarchical nesting. There is no limit on the number of factors that can be analysed. A new algorithm ensures correct derivation of expected mean squares (EMS) and correct construction of pseudo-F ratios for each term in the model, with tests done using permutations.
-
A new ‘Design’ type of worksheet file (*.ppd) is introduced into PRIMER with this add-on package. Its sole function is to outline the correct experimental design for subsequent analysis by PERMANOVA. It is linked to the resemblance matrix to be analysed, and so utilises important information regarding the available factors and their levels accordingly. When created, the user specifies whether factors are fixed or random and whether they are nested within one or more other factors. A new feature is the ability to test the design file using dummy data. This will output EMS’s and will identify the numerator and denominator mean squares and degrees of freedom for each term in the model. This allows the user to check a specified design and to consider the potential power for individual terms in the model, even before data are collected.
-
Pair-wise tests in PERMANOVA are now done taking into account the position of the factor of interest within the full experimental design. In the DOS version, the data corresponding only to the two levels of the factor being compared were extracted and considered in isolation for each test. The Windows version, however, retains the full experimental design and treats the pair-wise test effectively as a 1df contrast between those two levels. This ensures that the correct denominator is used for all tests and that the structure of the full design, including any necessary conditioning, is maintained (which is especially important for unbalanced designs or when there are covariates).
-
Terms which traditionally have had “no test” in PERMANOVA, due to the complexity of the design (usually caused by multiple random effects), are now tested using correct linear combinations of appropriate mean squares.
-
Pooling or the exclusion of one or more individual terms in the model is now possible in PERMANOVA, as is the analysis of models lacking replication, such as randomised blocks, split-plots and repeated measures. The order in which terms are fitted can also be specified explicitly by the user (important in either unbalanced designs or designs with covariates where Type I SS are used).
-
The user can now choose the type of sums of squares to use (Type I, II or III SS) in PERMANOVA. These types are equivalent for balanced designs, but not for unbalanced designs or designs with covariates. An enhanced algorithm even allows for imbalance in the actual cell structure of the model, which is especially useful in the context of asymmetrical experimental designs (e.g., Underwood (1994) , Glasby (1997) ).
-
The new PERMANOVA routine also allows the user to specify and test particular 1 df contrasts of interest (such as a treatment versus a number of different control groups) as well as the interaction of such contrasts with other factors.
-
The method used to fit covariables in the DOS version of PERMANOVA was a naïve approach that did not adjust the EMS’s of the other terms in the ANOVA model accordingly3. Thus, the results obtained from the two versions will differ for a given (balanced) data set if there are covariables (the new Windows version is correct).
-
In PERMDISP, the user now has the option of whether distances are calculated to centroids or to spatial medians and also whether P-values are obtained using permutations or tabled values for the F ratio (the default is to use centroids and permutations, as recommended in Anderson (2006) ). This speeds up the routine considerably, as clearly it is not necessary to perform all four possible combinations of these approaches, as is done in the DOS version.
-
The PCO routine yields graphical output that has all of the facilities that similar graphical objects (like PCA plots) in PRIMER possess, including choices for symbols and labels, the ability to observe and spin 3-d plots, and to superimpose bubbles. A new graphical feature offered with the PERMANOVA+ add-on is the ability to overlay vectors that correspond to either individual or partial correlations between variables in a worksheet and ordination axes. These may be the original variables, transformed variables, or some other variables of interest.
-
A new tool provided in PERMANOVA+ allows the user to calculate distance matrices among centroids identified by factors (or cells consisting of combinations of factors) in the space of a chosen resemblance measure. From this, centroids can then be further analysed or viewed in ordinations (handy for complex designs), also enabling the visualisation of relative effect sizes.
-
The DOS version of DISTLM and its cousin, DISTLM_forward, have been dramatically enhanced in the DISTLM routine of PERMANOVA+ for PRIMER. The DOS version only performed forward selection on the basis of the simple $R ^2$ criterion, whereas the new DISTLM is a true multivariate regression modelling tool on the basis of a chosen resemblance measure. The user may now choose among four model selection procedures (forward selection, backwards elimination, step-wise selection, or the “best” of all possible combinations) on the basis of any of 4 model selection criteria ($R ^2$, adjusted $R ^2$, and multivariate analogues of AIC or BIC). In addition, if one specifies “best” as the model selection procedure, then one may also choose how many of the top solutions to view and also whether to view relatively brief or more detailed results.
-
The new DISTLM routine in PERMANOVA+ uses the existing utility in PRIMER of specifying sets of variables using indicators, so that these may be kept together during model selection (e.g., spatial, temporal and environmental variables, Anderson & Gribble (1998) ). Identifying sets of variables is also useful for binary indicators or matrices that code for a categorical variable or factor in model selection or fitting.
-
DISTLM also allows the user to explicitly identify particular predictor variables (or sets of them) to be included or excluded in the model (or in the model selection activity), and optionally can also specify the order in which the variables (or sets) are to be fit.
-
The relationship between patterns in a resemblance matrix and a set of predictor variables (such as environmental variables) can be observed directly using a constrained ordination: distance-based redundancy analysis (dbRDA). This is a completely new routine. Vector overlays of the predictor variables are superimposed automatically. Like PCO, the dbRDA ordination routine also takes full advantage of all of the tools offered in other PRIMER Windows graphics (e.g., choice of which axes to view, in two or in three dimensions, ample choice of labels and symbols, etc.). DISTLM is also directly linked to dbRDA, providing an instant constrained ordination, if desired, for any given fitted model.
-
The CAP routine in PERMANOVA+ for PRIMER includes graphical output as well as the usual text output and diagnostics that would be familiar to users of the former CAP program in DOS. This graphical output (as for PCO or dbRDA) has all of the usual advantages of other PRIMER ordination graphics, including the new general vector overlay tool available in PERMANOVA+.
-
A brand new feature of the CAP routine is the ability to add new samples into the CAP model and “see where they fall”. This is highly useful for model validation and for classifying new samples whose group identity is unknown. The positions of the new samples are given in the canonical space in the text output file and visually in the CAP ordination graphic. If the CAP analysis focused on discriminating groups, then the new samples are also allocated to a new group based on their positions in the canonical space.
3 Unfortunately, when a covariable is added to an ANOVA model, then the terms in the model are no longer orthogonal (independent) of one another, even if the design is balanced.
0.5 Using this manual
Typographic conventions
The typographic conventions for this manual follow those used by Clarke & Gorley (2006) for PRIMER v6, as follows:
Text in bold indicates the menu items that need to be selected,
> denotes cascading sub-menu items, tab choices, dialog boxes or sub-boxes,
$\bullet$ denotes a button entry in a dialog box (so-called ‘radio buttons’ – only one can be selected),
$\checkmark$ indicates a tick in the specified box (so called ‘check boxes’ – either on or off),
text inside a cartouche is an instruction to select the suggested entry (e.g., filename) or actually to type it in, and
( ) & ( ) & ( ) indicate several steps that need to be carried out in the one box, where brackets are used naturally to split up the different components of the dialog.
For example:
Analyse>Resemblance>(Analyse between$\bullet$Samples) & (Measure$\bullet$Bray-Curtis similarity) & ($\checkmark$Add dummy variable>Value: 1)
is an instruction to select the main menu item Analyse, the sub-menu item Resemblance, and analyse between samples using Bray-Curtis similarity, adding a dummy species with value 1 for all samples, prior to computing similarities (see Clarke, Somerfield & Chapman (2006) ). The dialog this corresponds to is shown below in Fig. D.1.
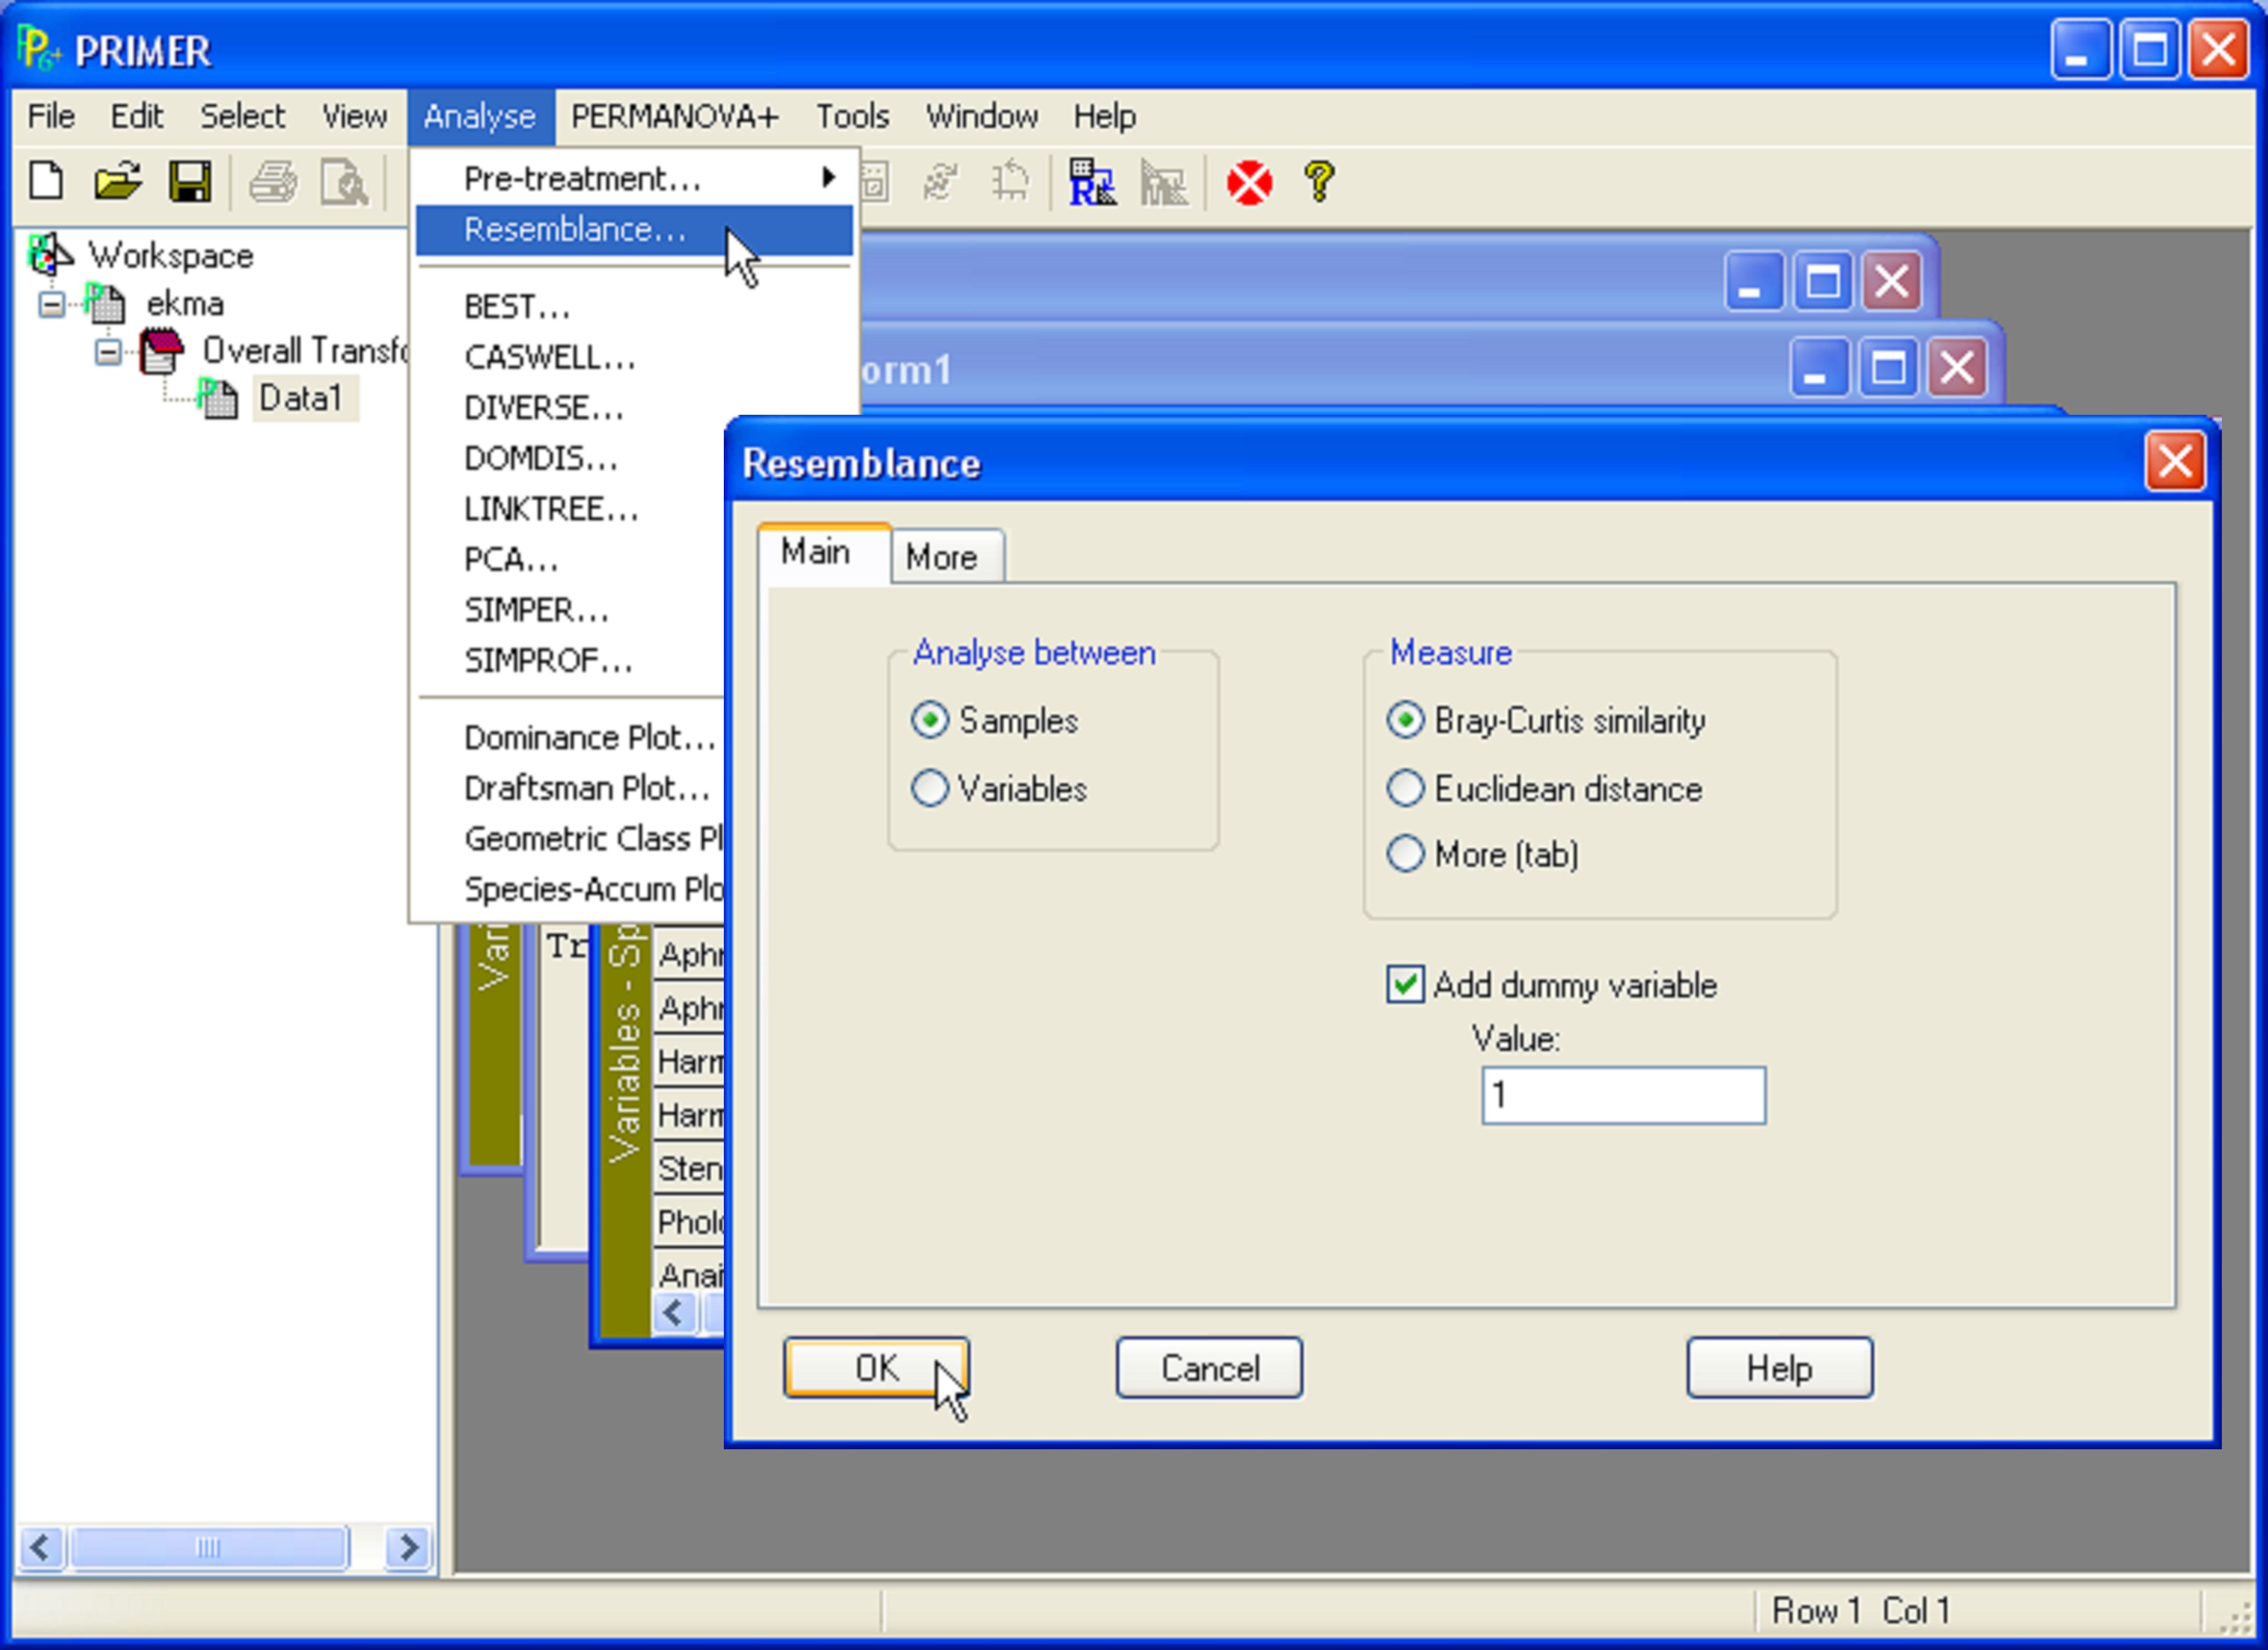 Fig. D.1. Example of the directions: Analyse>Resemblance>(Analyse between$\bullet$Samples) & (Measure$\bullet$Bray-Curtis similarity) & ($\checkmark$Add dummy variable>Value: 1).
Example data sets
The PRIMER CD contains a number of example data files needed for this manual. The installation will place a number of sub-directories (e.g., BorneoBirds, HoldNZ, FishNZ, VictAvi, MedMoll, etc.) into an ‘Examples add-on’ directory (the default installation location is C:\Program Files\PRIMER-E\PRIMER 6\Examples add-on\ ). These files can also be read directly from the CD as you run the package. You might find it convenient, however, to copy them to a higher-level data area on your hard disk. In what follows, it is assumed that they are in a top-level directory C:\Examples add-on\ . The various sub-directories contain data files (generally in .pri or .xls formats) that correspond to particular examples used in this manual. Examples from PRIMER v6 (located in the Examples v6 directory) will also be used and referred to from time to time. Details of these examples are provided in the User Manual/Tutorial for PRIMER v6 ( Clarke & Gorley (2006) ).
At the end of the manual there is an index of the example data sets included, the name of the files in which they are each contained, the topics for which they are used to exemplify certain points, and page numbers identifying where they are referenced in the manual.
Finding your way around
Each chapter is devoted to a particular routine and begins with a few key references followed by a general description of the method. The methods should be cited using these key references, as appropriate. The general citation for either the software itself or the manual is found on the inside front cover of this manual.
Descriptions of the methods and the examples provided are deliberately conceptual in nature and avoid, as far as possible, the use of mathematical notation and matrix algebra. A complete understanding of this matrix algebra, wherever it appears, is by no means necessary, however, for the successful use, understanding and interpretation of results of all of the routines provided by PERMANOVA+, in much the same way as it is not necessary to understand the finer mathematical details of non-metric MDS in order nevertheless to implement and interpret the output from the MDS routine in PRIMER. Rather, such information is provided for users with a mathematical bent who are interested in some of the underlying nuts and bolts, particularly with respect to the links, commonalities and differences among the different routines.
In addition to the index of occurrences of data sets, there is also an index of mathematical notation and symbols as well as a general index of topics at the end of the manual.