# 4.6 (Holdfast invertebrates)
To demonstrate conditional tests in DISTLM, we will consider the number of species inhabiting holdfasts of the kelp *Ecklonia radiata* in the dataset from New Zealand, located in the file hold.pri in the ‘HoldNZ’ folder of the ‘Examples add-on’ directory. These multivariate data were analysed in the section entitled [Designs with covariates](https://learninghub.primer-e.com/books/permanova-for-primer-guide-to-software-and-statistical-methods/page/135-designs-with-covariates-holdfast-invertebrates-revisited) in [chapter 1](https://learninghub.primer-e.com/books/permanova-for-primer-guide-to-software-and-statistical-methods/chapter/chapter-1-permutational-anova-and-manova-permanova). Due to the well-known species-area relationship in ecology, we expect the number of species to increase with the volume (size) of the holdfast ({{@324#bkmrk-smith1996a}}, {{@324#bkmrk-anderson2005a}}, {{@324#bkmrk-anderson2005b}}). In addition, the density of the kelp forest surrounding a particular kelp plant might also affect the number of species able to immigrate or emigrate to/from the holdfast ({{@324#bkmrk-goodsell2002a}}) and depth can also play a role in structuring holdfast communities ({{@324#bkmrk-coleman2007a}}). Volume (in ml), density of surrounding *Ecklonia* plants (per m$^2$) and depth (in m) were all measured as part of this study and are contained in the file holdenv.pri. The associated draftsman plot (Fig. 1.45) shows that these variables are reasonably evenly distributed across their range (see [Assumptions & diagnostics](https://learninghub.primer-e.com/books/permanova-for-primer-guide-to-software-and-statistical-methods/page/47-assumptions-diagnostics)).
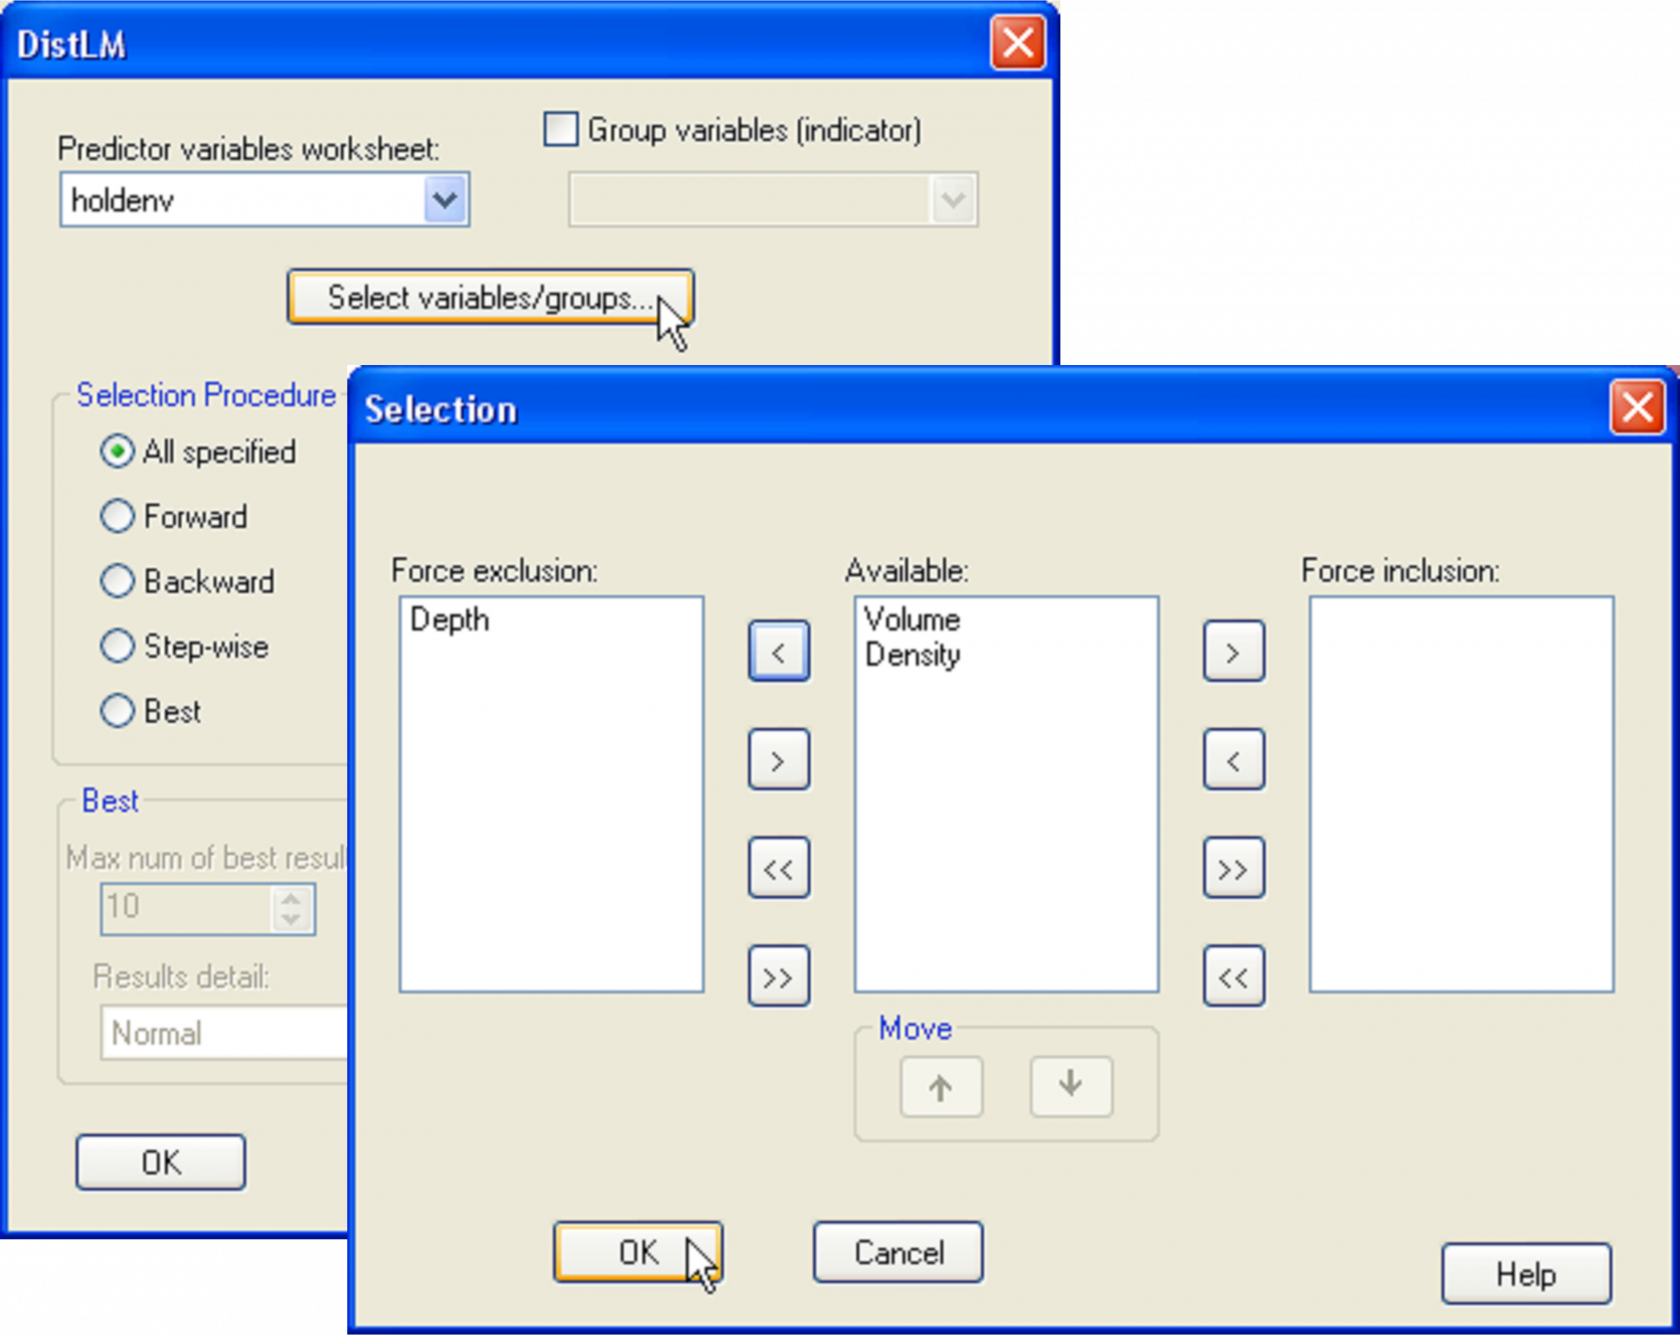
Here, we will focus on the number of species of molluscs only, as members of this phylum were all identified down to species level. Open the file hold.pri in PRIMER, select the molluscan species only and duplicate these into their own sheet, named molluscs, as shown in Fig. 1.27 in the section entitled [Nested designs](https://learninghub.primer-e.com/books/permanova-for-primer-guide-to-software-and-statistical-methods/page/127-nested-design-holdfast-invertebrates) of [chapter 1](https://learninghub.primer-e.com/books/permanova-for-primer-guide-to-software-and-statistical-methods/chapter/chapter-1-permutational-anova-and-manova-permanova). Choose **Analyse > DIVERSE** and retain only the tick mark next to $\checkmark$Total species: S on the ‘Other’ tab, but remove all others. Also choose to get $\checkmark$Results to worksheet and name the resulting sheet No.species. This will be the (in this case univariate) response variable for the analysis. Calculate a Euclidean distance matrix among samples on the basis of this variable. Next, open up the holdenv.pri file in PRIMER. Here we shall focus on running the analysis on only two predictor variables: volume and density, asking the specific question: does density explain a significant portion of the variation in the number of species of molluscs after volume is taken into account? Do this by choosing **PERMANOVA+ > DISTLM** > (Predictor variables worksheet: holdenv) and click on the button marked ‘Select variables/groups’. This opens up a ‘Selection’ dialog where you can choose to force the inclusion or exclusion of particular variables from the model and you can also change the order in which the variables (listed in the ‘Available’ column) are fitted. Choose to exclude depth for the moment and to fit volume first, followed by density (see Fig. 4.8). Back in the DISTLM dialog, choose (Selection procedure •All specified) & (Selection criterion •R^2) & (Num. permutations: 9999).
[](https://learninghub.primer-e.com/uploads/images/gallery/2022-08/fig4-8.png)
**Fig. 4.8.** Dialog in DISTLM for specifying a model with two variables, volume and density (in that order), but excluding the variable of depth.
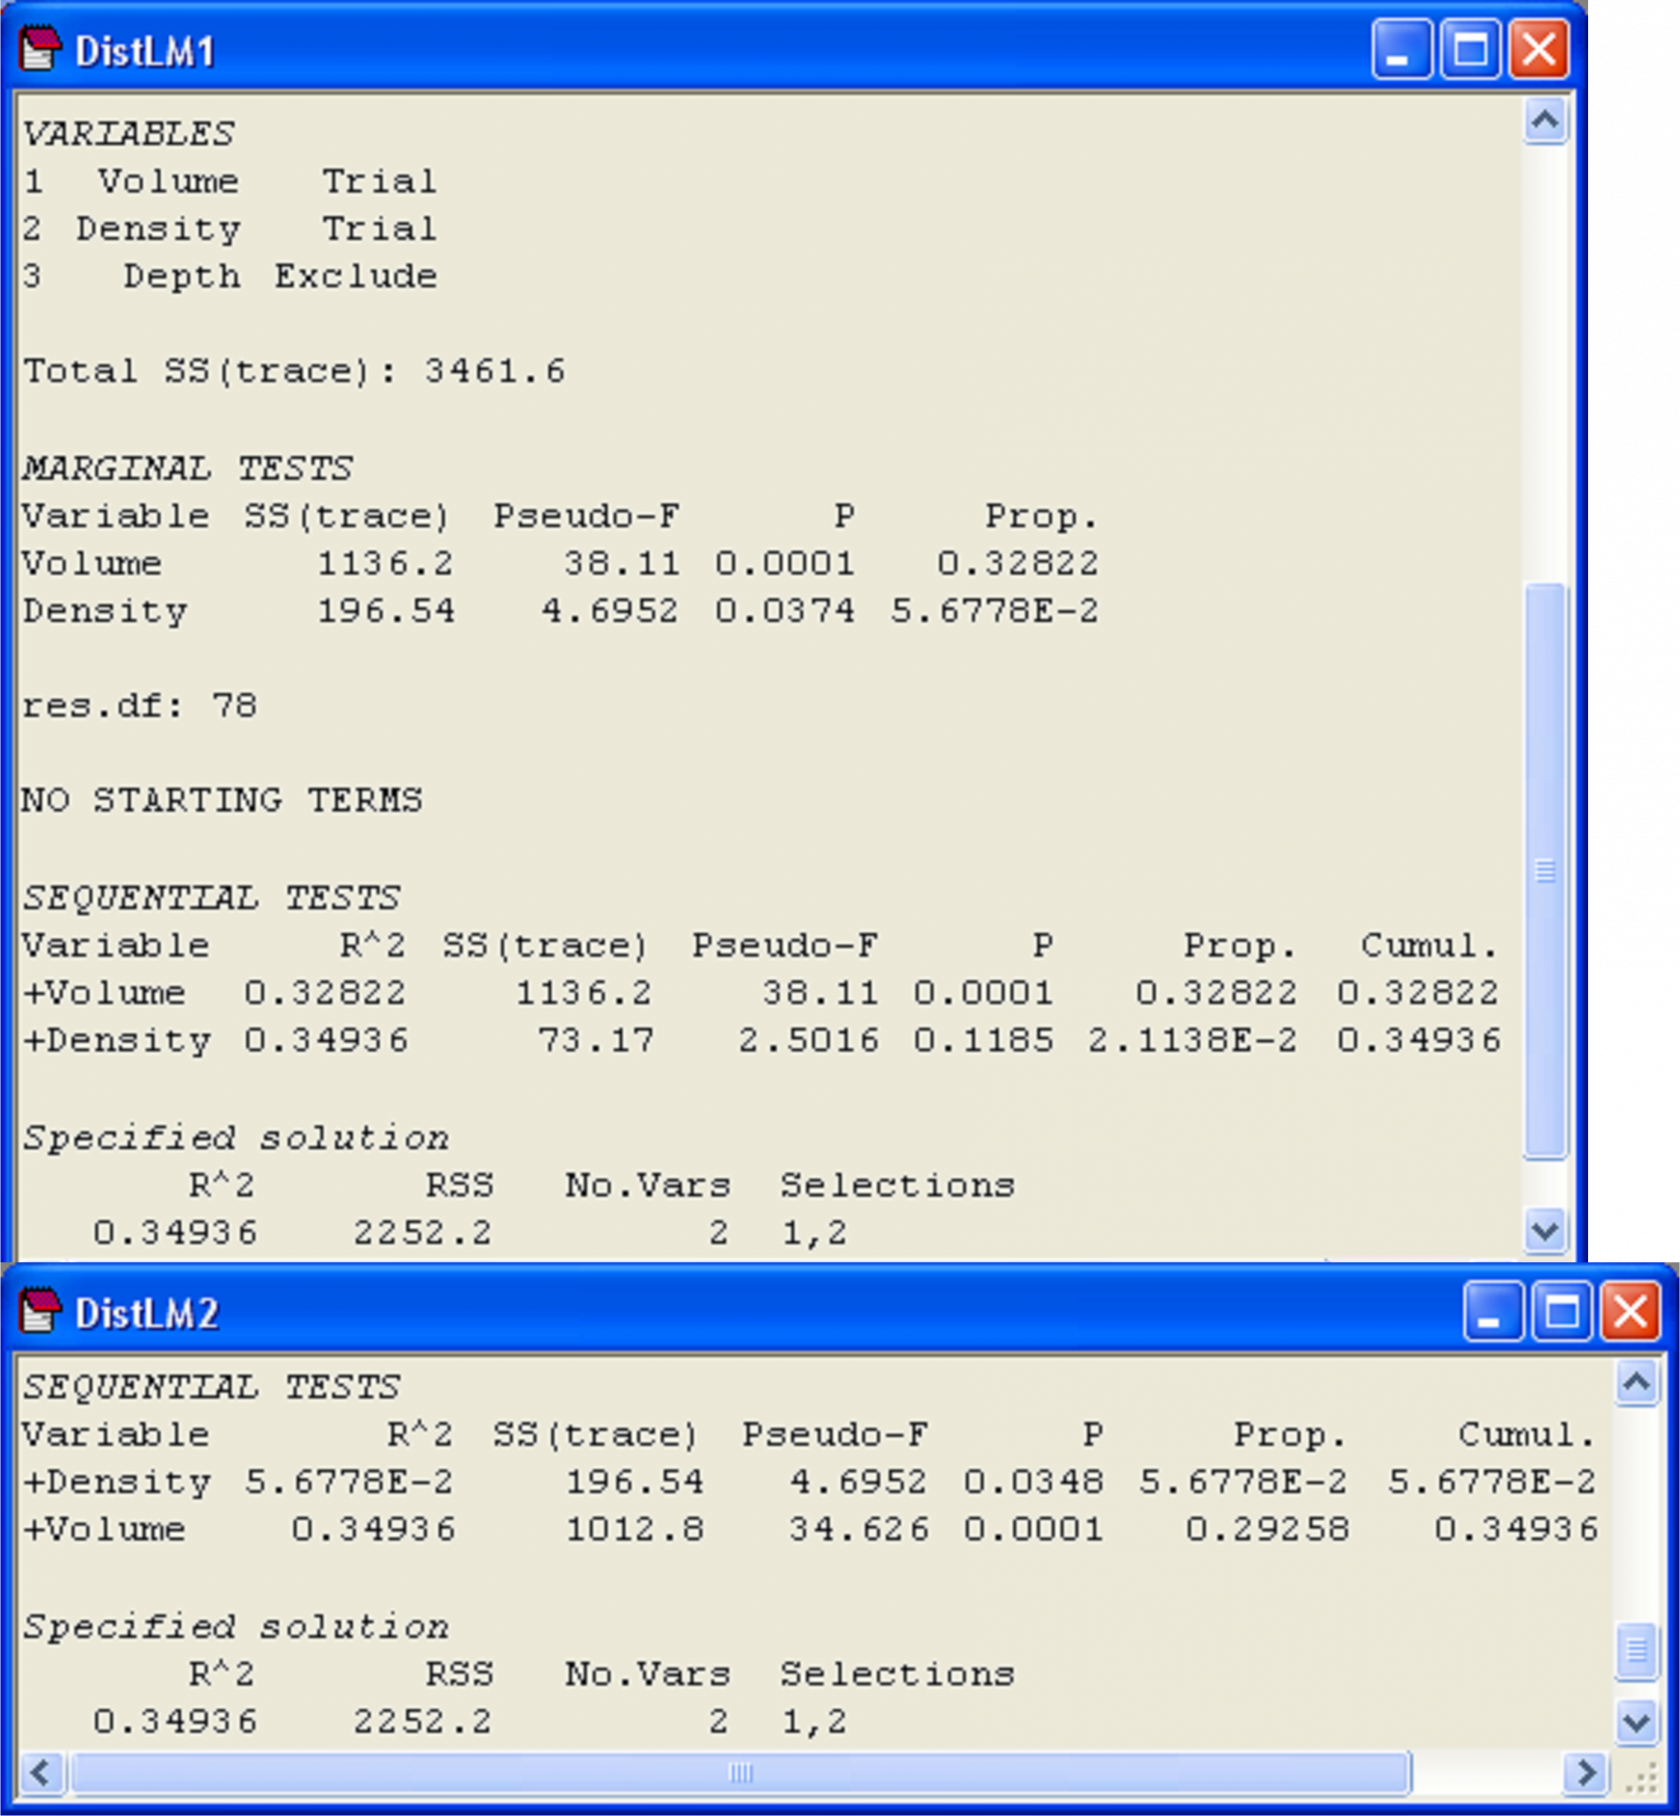
The results (Fig. 4.9) show first the *marginal* tests of how much each variable explains when taken alone, *ignoring* all other variables. Here, we see that volume explains a significant amount of about 32.8% of the variation in the number of mollusc species (*P* = 0.0001). Density, when considered alone, only explains about 5.7% of the variation, but this small amount is nevertheless found to be statistically significant when tested by permutation (*P* = 0.037). Note that these marginal tests do not include any corrections for multiple testing. Although this is not such a big issue in the present example, where there are only two marginal tests, clearly the probability of rejecting a null hypothesis by chance will increase the more tests we do, and if there are a lot of predictor variables, the user may wish to adjust the level of significance at which individual tests reject their null hypothesis. The philosophy taken here, as in the case of multiple pair-wise tests in the PERMANOVA routine, is that the permutation approach provides an exact test for each of these individual hypotheses. It is then up to the user to decide whether or not to apply subsequent corrections, if any, to guard against the potential inflation of overall rates of error.
[](https://learninghub.primer-e.com/uploads/images/gallery/2022-08/fig4-9.png)
**Fig. 4.9.** Results from DISTLM obtained by first fitting volume followed by density (‘DistLM1’), including marginal tests, and then by fitting density followed by volume (‘DistLM2’).
Following the marginal tests in the output file, there is a section that contains *sequential* tests. These are the conditional tests of individual variables done in the order specified. All variables appearing above a particular variable are fitted as covariates, and each test examines whether adding that particular variable contributes significantly to the explained variation. In our case, we have the test of whether density adds a significant amount to the explained variation, given that volume has already been included in the model. These sequential conditional tests correspond directly to the notion of Type I SS met in [chapter 1](https://learninghub.primer-e.com/books/permanova-for-primer-guide-to-software-and-statistical-methods/chapter/chapter-1-permutational-anova-and-manova-permanova) (e.g., see Fig. 1.41). That is, we fit variable 1, then variable 2 *given* variable 1, then variable 3 *given* variables 1 and 2, and so on. In the present example (Fig. 4.9, ‘DistLM1’), density adds only about an additional 2.1% to the explained variation once volume has been fitted, and this is not statistically significant (*P* = 0.12). The column labeled ‘Prop.’ in the section of the output entitled ‘Sequential tests’ indicates the increase in the proportion of explained variation attributable to each variable that is added, and the column labeled ‘Cumul.’ provides a running cumulative total. For this example, these two variables together explained 34.9% of the variation in number of mollusc species in the holdfasts.
We can re-run this analysis and change the order in which the variables are fitted. This is done by clicking on particular variables and using the ‘Move’ arrows under the names of variables listed in the ‘Available’ column of the ‘Selection’ dialog box within DISTLM. There is no need to include marginal tests again, so we can also remove the tick in front of ‘Do marginal tests’ in the ordinary DISTLM dialog. When we fit density first, followed by volume, it is not at all surprising to find that: (i) volume explains a significant proportion of variation even after fitting density and (ii) the variation explained by both variables together remains the same, at 34.9% (Fig. 4.9, ‘DistLM2’).