# 1-way layout (Biomarkers example)
ANOSIM applies equally well to data on environmental, biomarker or morphometric variables, which might be transformable to approximate normality; it is then a robust alternative to classical multivariate (MANOVA) tests such as Wilks’ lambda. The inevitable slight loss in power of the non-parametric test, if the data really were multivariate normal (and had few enough variables in relation to sample sizes to allow proper estimation) is more than compensated for by its robustness, general applicability, and lack of assumptions such as constant variance-covariance structures.
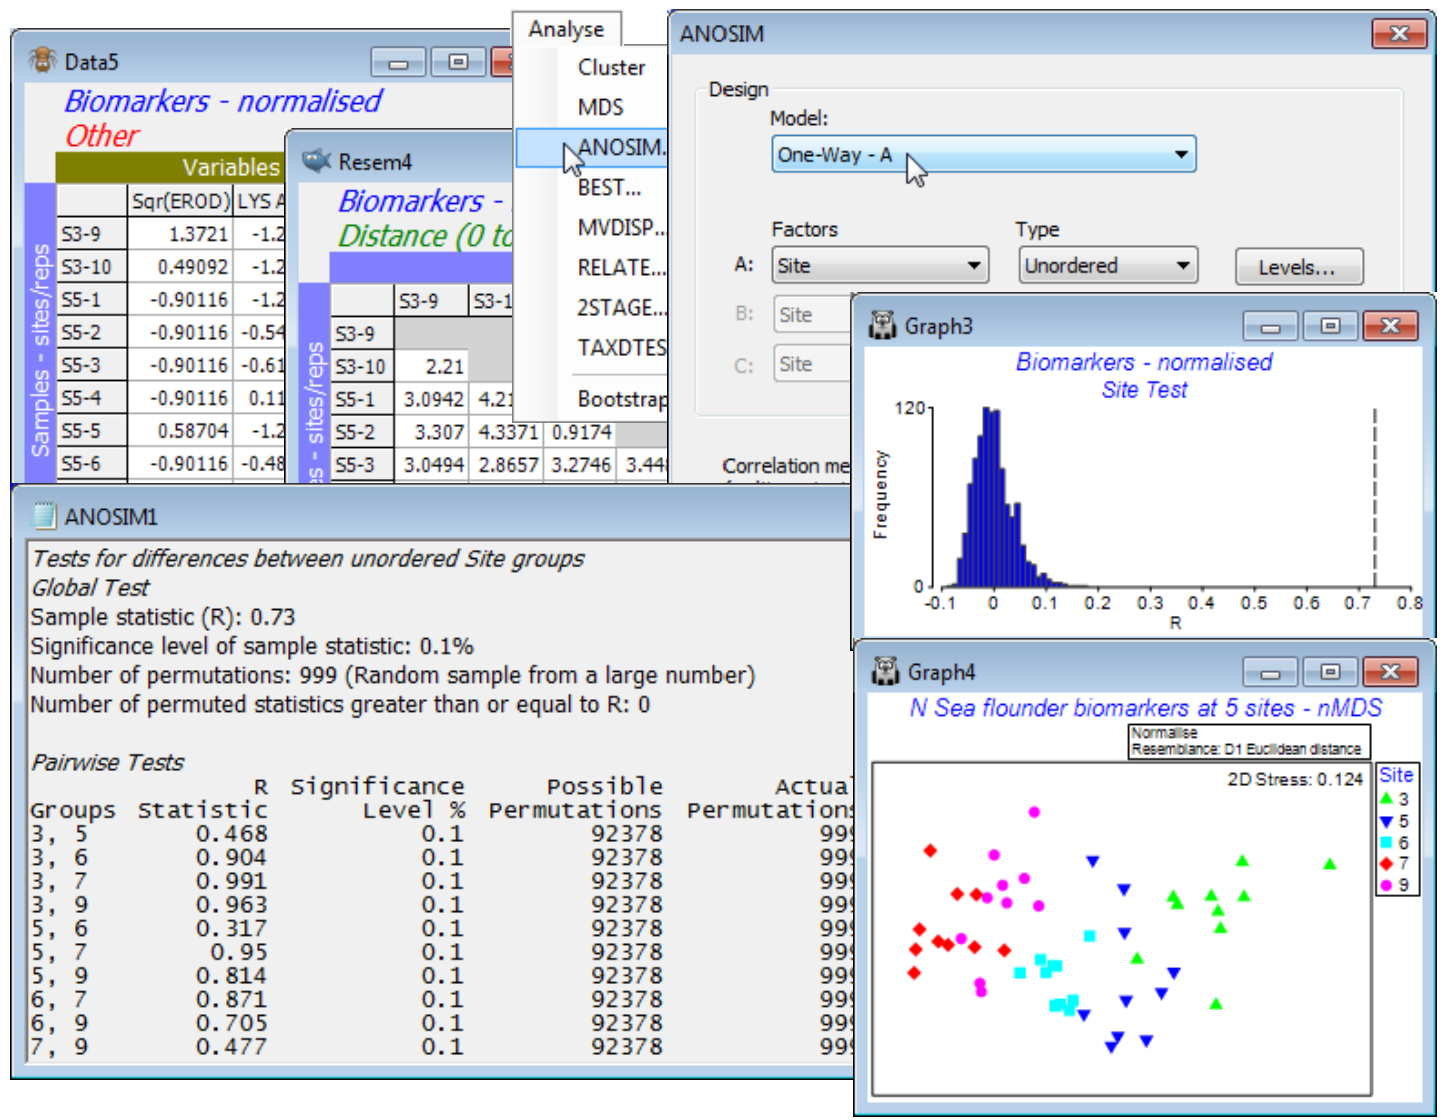
Re open the N Sea ws workspace seen in Sections [4](https://learninghub.primer-e.com/books/primer-v7-user-manual-tutorial/chapter/4-pre-treatment-options) & [5](https://learninghub.primer-e.com/books/primer-v7-user-manual-tutorial/chapter/5-resemblance-similarities-dissimilarities-and-distances), with datasheet N Sea flounder biomarkers of 10 replicates from each of 5 N Sea sites, S3, S5, S6, S7, S9 (directory C:\Examples v7\N Sea biomarkers). Of the suite of 11 biomarkers it was previously suggested that EROD and LIPID VAC might benefit from square root transformation, being modestly right-skewed – earlier performed by highlighting them and **Pre-treatment>Transformation(individual)**>(Expression: SQR(V)). The variables are put on a common measurement scale with **Pre-treatment>Normalise Variables** and an appropriate resemblance calculation is **Analyse>Resemblance**>(Measure•Euclidean distance), before **Analyse>ANOSIM** on factor Site, as above. The results show a significant (mainly large) separation of the biomarker responses at all sites, seen clearly also in an *n*MDS plot (or *m*MDS would have nearly as good a stress here). Resave and close the workspace, N Sea ws.
[](https://learninghub.primer-e.com/uploads/images/gallery/2024-07/screenshotpage156a.png)
In this example, the sites were along a transect from the mouth of the Elbe (S3) to the Dogger Bank (S9) but there was no strong presumption in advance of the data collection that responses of the biomarker suite, if present at all, must conform to a monotonic gradient of change. This is not a clear case of a decreasing contaminant gradient with distance from a point source impact, since over such a large geographic region (and with motile organisms) many environmental drivers may be in play, only some of them anthropogenic. An ordered ANOSIM test would then run the risk of failing to detect differences among sites if these are not in the physical order of the sites along the transect. And, whilst the above *n*MDS does then show responses that are mainly aligned with the transect - and the ordered RO gives a similar and also highly significant value of 0.74 compared to the unordered R=0.73 statistic - this pattern is not entirely consistent (e.g. sites 6, 7 and 9). Of course, a decision about which test to use should be made prior to seeing any data, and it would have been unwise to opt for the ordered test and rule out any possibility of detecting community changes in which, for example, both ends of the transect were impacted in the same way (and therefore similar to each other) but the mid-transect sites reflected a different background state.