# 1-way ordered without replication
In the unordered 1-way design, replication is essential for any sort of test (otherwise how can you tell whether single samples from groups A, B, C, … are from the same or different communities? – there are no within-group rank dissimilarities to compare with among-group ones). For the ordered 1-way design, however, the test statistic R$^\text{O}$ can still be constructed – see the explanation in CiMC Chapter 6 under ANOSIM for ordered factors, where the statistic for the unreplicated design is designated R$^\text{Os}$, for *ordered single*, rather than R$^\text{Oc}$, for *ordered category* (though in both cases it is fundamentally the same slope statistic R$^\text{O}$ from a regression of rank dissimilarities against modelled rank distances under the alternative hypothesis). A univariate analogue you may find it helpful to think about is testing whether differences in a variable *y* bear any relation to given values of *x*. If you are not prepared to make any assumptions about the form of the relationship (the alternative hypothesis just says the values of *y* differ with those of *x* in some way unspecified) then you must have replicates at each *x* value in order to construct an (ANOVA-type) test. If, however, you set out to examine the alternative hypothesis that the relationship between *y* and *x* is linear, then there is a perfectly viable test without any replication of *x* levels, i.e. whether the slope of a linear regression of *y* on *x* is significantly different from zero. And you may choose that linear regression test even when there are replicates at each *x* level. This is actually a very precise analogue of the difference between ordered R$^\text{O}$ (regression-type) and unordered R (ANOVA-type) ANOSIM tests.
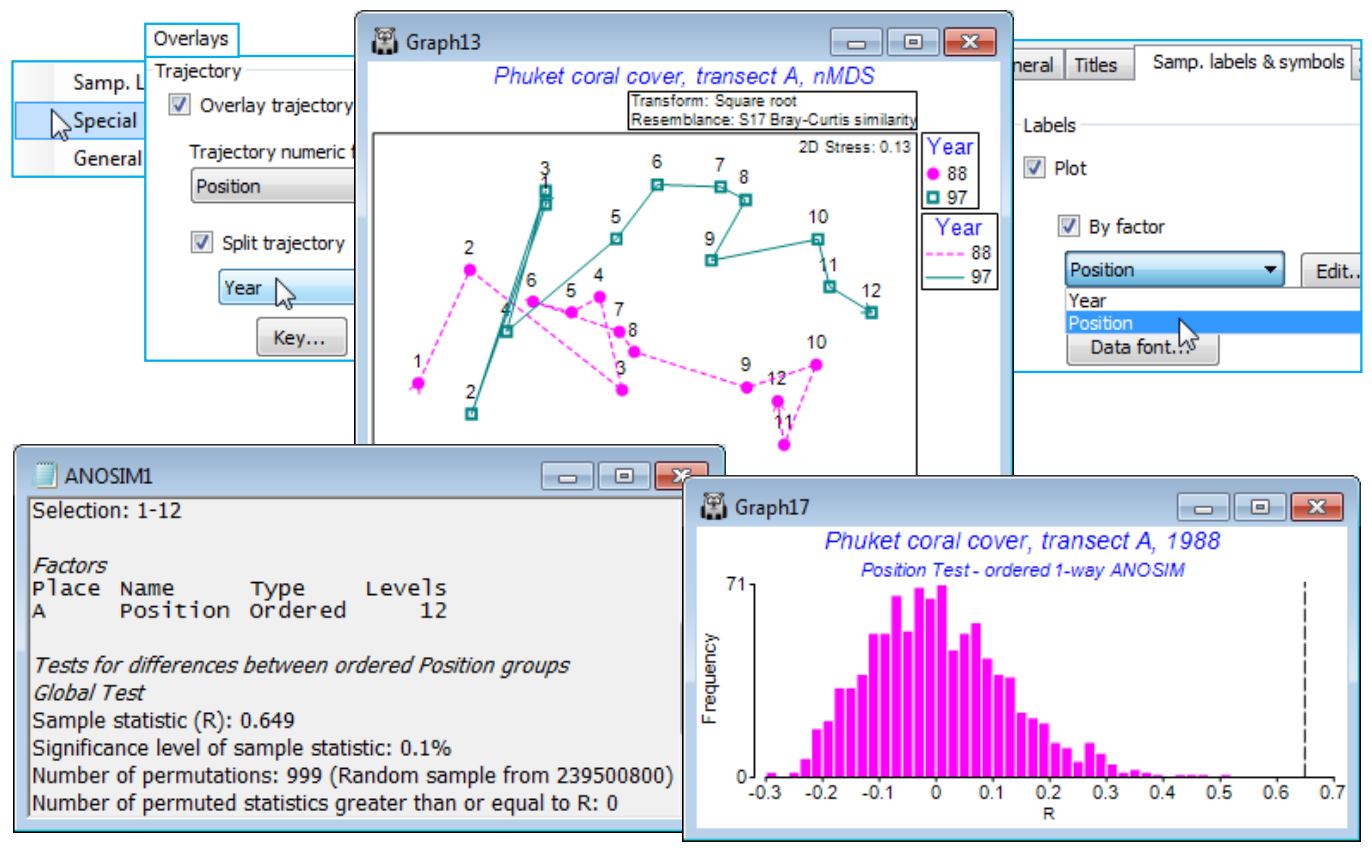
So, for the Phuket coral cover 88-97 data, take a square-root transform and Bray-Curtis similarities, selecting from the latter the first and last years 88 and 97 (i.e. 24 samples, the 12 transect positions in each year) and reproduce the *n*MDS plot seen in Fig. 6.14 of CiMC – with separate trajectories over transects for each year by taking **Graph>Special>Overlays**>(✓Overlay trajectory Position)> (✓Split trajectory Year) and on **Samp. labels & symbols**, (Labels✓Plot)>(✓By factor Position). It is scarcely necessary to test the null hypothesis of no *Position* effect for each of these years but a 1-way ordered test (without replicates) can be carried out by selecting each year in turn, and **Analyse >ANOSIM**>(Model•One-Way - A)>(Factors A: Position)>(Type Ordered) gives R$^\text{Os}$ = 0.65 and 0.73 respectively (both p<0.1%).
[](https://learninghub.primer-e.com/uploads/images/gallery/2024-07/screenshotpage161a.png)