# 2-way crossed ANOSIM (Danish sediment data; Phuket coral reefs)
For an example of a 2-way crossed ANOSIM test in a very different context, save and close the above workspace and return to the particle size distributions from Danish sediments introduced at the very end of Section [4](https://learninghub.primer-e.com/books/primer-v7-user-manual-tutorial/chapter/4-pre-treatment-options) – the workspace Denmark ws in C:\Examples v7\Denmark PSA, with particle size frequency data (over 6 size-categories) in Denmark PSA histogram, for 3 sites (A, B, C) crossed with 2 depths (2m and 5m), and 5 replicate samples from each combination of site and depth. A distance measure such as Euclidean (or Manhattan or Maximum distance, see Section [5](https://learninghub.primer-e.com/books/primer-v7-user-manual-tutorial/chapter/5-resemblance-similarities-dissimilarities-and-distances)) is appropriate for defining the resemblance between two distribution curves.
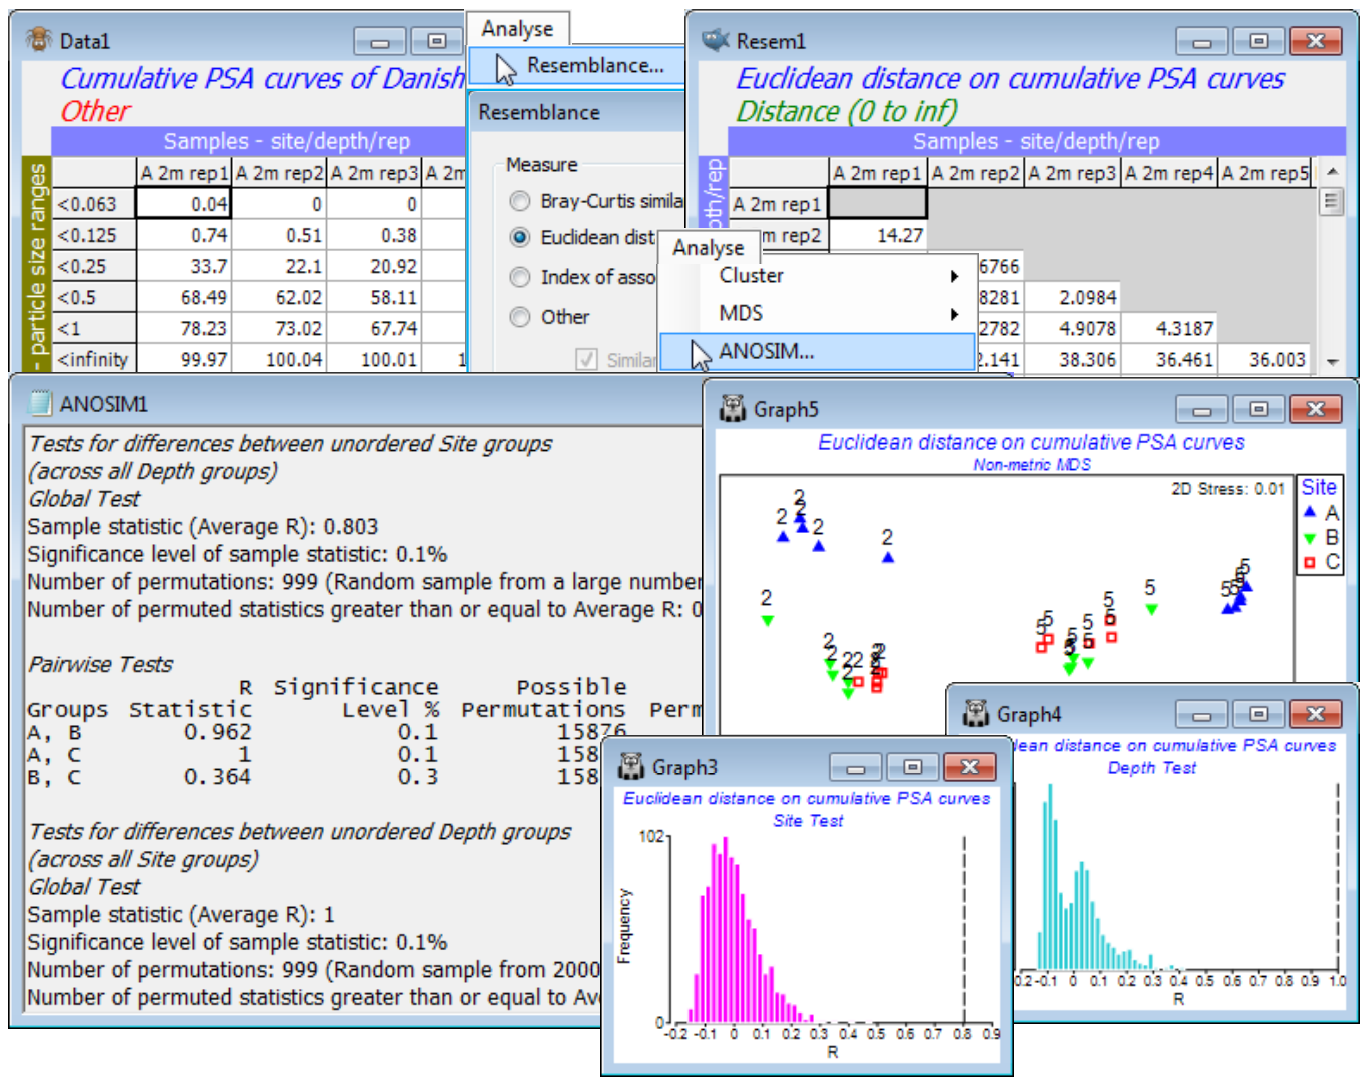
As suggested earlier, apply this to the (smoother) cumulative frequencies from **Pre-treatment> Cumulate Samples**>(Variable Order•As worksheet), and on the resulting resemblance matrix run **Analyse>ANOSIM**, with the 2-way crossed option for factors Site and Depth (in some cases, the latter might be considered ordered, but we have only 2 depths here so the distinction is irrelevant; Site is clearly unordered). The results show perfect separation of the depths (global average R = 1, p<0.1%) and strong separation of the sites (global average R = 0.80, p<0.1%). The large number of possible permutations means that these p values could be made almost arbitrarily small, as is clear from the null distribution histograms. Pairwise site tests show, however, that B and C are not well separated (average R = 0.36, though still larger than all but 2 of the 999 permutations considered from the full set of 15876, thus p<0.3%), as is also seen in an *n*MDS plot on the Euclidean distance matrix (or a PCA, see Section [12](https://learninghub.primer-e.com/books/primer-v7-user-manual-tutorial/chapter/12-analysing-environmental-variables-draftsman-plot-pca)). Close this workspace – it will not be needed again.
[](https://learninghub.primer-e.com/uploads/images/gallery/2024-07/screenshotpage160a.png)
The study of coral reef assemblages at Cape Panwa, Phuket, Thailand – introduced near the end of Section [8](https://learninghub.primer-e.com/books/primer-v7-user-manual-tutorial/chapter/8-multi-dimensional-scaling-non-metric-nmds-metric-mmds-combined-mds) – measured area cover of corals on twelve 10m line samples taken perpendicularly to an onshore to offshore transect (A), over a time series of years. The previous workspace, Phuket ws, contained the data only for 1983-87, and 1983 was selected to visualise community change along the A transect, seen in an *n*MDS. Here, you should open into that workspace (or a clear one) data from the 7 middle years, Phuket coral cover 88-97 in C:\Examples v7\Phuket corals. Factors Year (88, 91, 92, 93, 94, 95, 97) and Position on the A transect (1-12) form a 2-way crossed design, because each position is examined (*plotless line sample*) in each year, but there is no replication