# 2-way nested ANOSIM (Calafuria macroalgae)
Subtidal rocky reefs, at *ca* 10m depth, at the Calafuria station in the Ligurian Sea, N Italy, were the subject of a clearance and recovery experiment by Airoldi L 2000 *Mar Ecol Prog Ser* 195: 81-92 (see also Clarke KR, Somerfield PJ, Airoldi L, Warwick RM 2006, *J Exp Mar Biol Ecol* 338: 179-192; both sources analyse a wider set of data than considered here). For 8 different times between October 1995 and September 1996 (factor A: named *treatment*, with levels 1 to 8), rock patches were cleared from three randomly chosen areas (factor B: *area* with levels 1 to 24, the three areas differing for each ‘treatment’, naturally). Three randomly chosen *plots* from each area (replicates) were then examined at the end of one year of recolonisation, and % area cover recorded of nine macroalgal taxonomic categories. The design is therefore a *2-way nested* layout, with factor A (Trt) at the top level and B (Area) nested within A, denoted B(A) – replicates can be thought of as nested within B (replicates are always nested). Note that when defining the factor levels, PRIMER does not mind if you code the area levels as 1 to 24, or 1 to 3 repeatedly for each of the 8 treatments. If you use the latter, when 2-way nested is selected under **Analyse>ANOSIM**, and *area* is specified as nested, the routine will know that there is nothing in common between area 1, treatment 1 and area 1, treatment 2. But it may help you to code the area levels as 1 to 24, because the fact that area is nested, not crossed, with treatment will then be clear.
Open Calafuria algal cover from C:\Examples v7\Calafuria algae, and examine its factors with **Edit>Factors**. A strong transform is necessary to prevent the taxon category *Algal turf* from completely dominating, so transform with fourth root and calculate Bray-Curtis similarities between samples. The primary interest is in whether there are differences in recolonised macroalgal communities a year after clearance, depending on the time of year at which the clearance took place, i.e. a test of the treatment factor. But it is important to choose the correct replication level for this test. This is usually (some would argue, always) the level of variability immediately below treatment in the hierarchy, namely the areas not the plots, which are a level further down. So, one possibility is simply to average the three plots within each area and carry out one-way ANOSIM on the Trt factor (with 3 replicate areas per treatment). But what if there is absolutely no area effect, i.e. plots in different areas are no more dissimilar from each other than plots in the same area? Then it would seem reasonable to take plots as the replication level for testing treatment effects, and the much greater number of replicates will improve the sensitivity of that test.
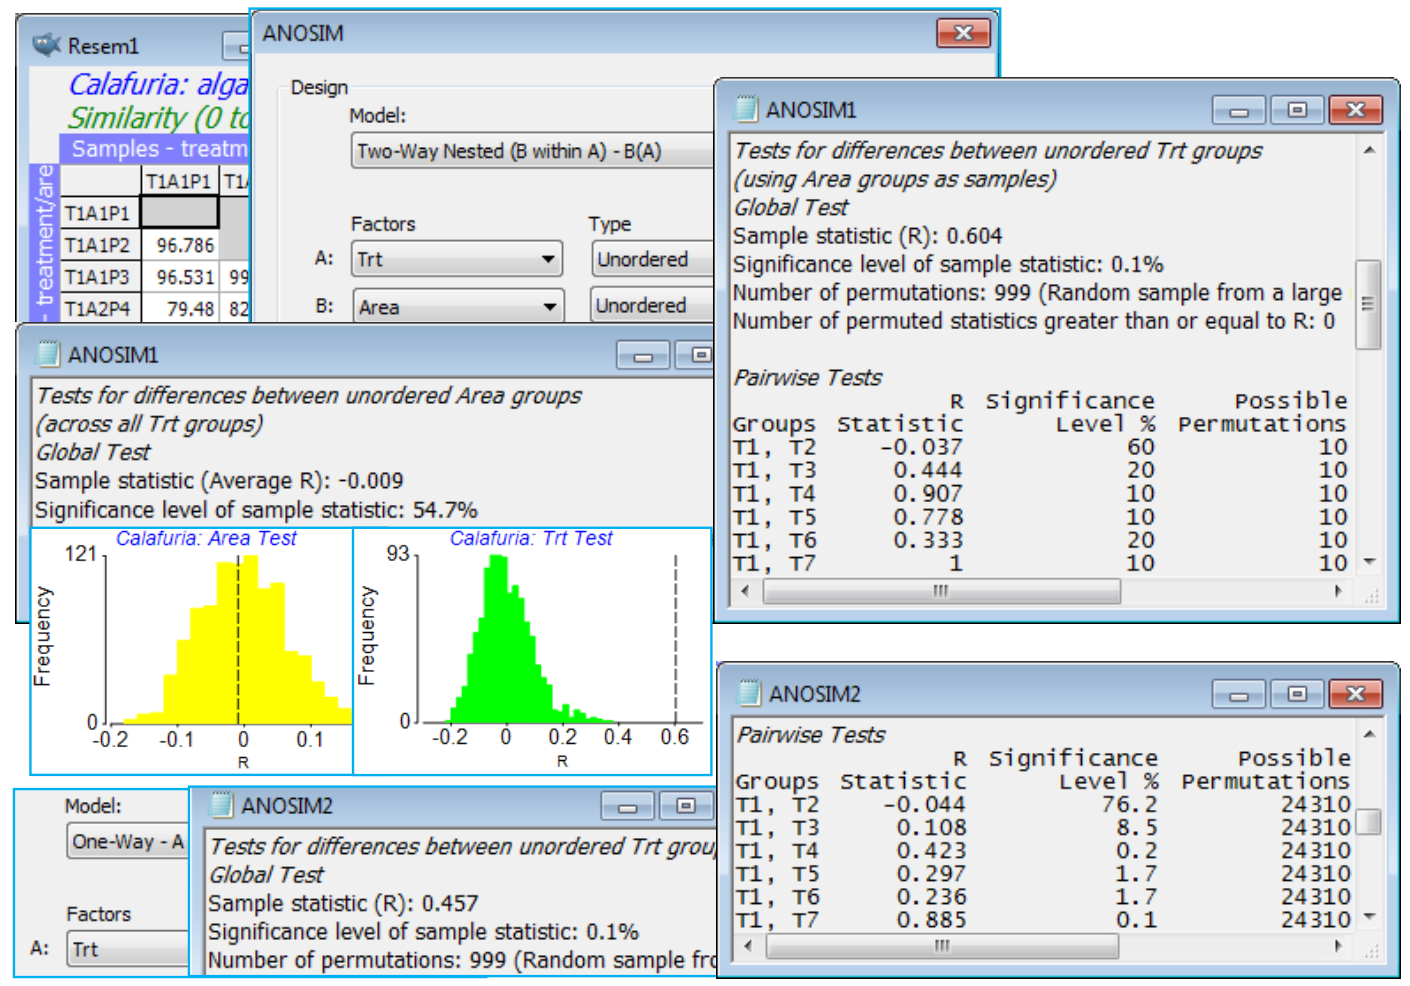
On the resemblances, take **Analyse>ANOSIM**>(Model: Two-Way Nested (B within A) - B(A))> (Factors A: Trt) & (B: Area), both of which are Unordered (the areas are randomly chosen from the region at each starting time, Trt, and though these starting times run sequentially through a year, a serial pattern for the algal recovery state a year later would not be expected – if anything it will be *cyclic* with the seasonality, see Section [14](https://learninghub.primer-e.com/books/primer-v7-user-manual-tutorial/chapter/14-further-matching-of-multivariate-patterns-relate-2stage-best-mvdisp) for such tests). The routine then carries out two tests. Firstly, it tests the null hypothesis that there is no area effect. Nothing is assumed about treatment effects; these may or may not be present but need to be removed, in exactly the same way as for the 2-way crossed ANOSIM (i.e. R values contrasting among- and within-area rank dissimilarities are calculated separately for each treatment and averaged; permutations are constrained to shuffle labels among plots only over areas within a treatment, not across treatments, etc.). Secondly, the routine then always presumes that an area effect is present, so tests the treatments by averaging the plots within areas, thus using areas as the replication level for this test, by a 1-way ANOSIM. (In fact, the averaging is done on the rank dissimilarity matrix, which is then re-ranked for the 1-way ANOSIM – see CiMC). If there is demonstrably no area effect at all, so the test can use all 9 plots as replicates of a treatment, this needs a separate run of 1-way ANOSIM, ignoring the area factor.
The 2-way nested test for areas here gives average R = –0.01 (p$\approx$56%) and this near-zero R implies absolutely no suggestion of an area effect, making the 2-way test for treatments (averaging up to area level) unnecessarily conservative. It still gives a strongly significant global R of 0.60 but the conservatism is seen in the pairwise table, where comparisons are based on only 10 permutations (3 areas for each treatment). If, as is justified here, we ignore the area effect, the 1-way ANOSIM (9 plots per treatment) gives a pairwise table with 24,310 permutations for each comparison and thus clear inferences, e.g. T7 and T8 differ the most strongly from other times, with most R values in excess of 0.8, whereas pairs not involving these two times generally give R<0.4. If the initial test for area had given R>0 however, and certainly if it had been significantly so, on what will usually be a powerful test (many permutations), then it would not be justifiable to ignore the area effect and use plots as replicates: this would be non-conservative (*pseudo-replication*). Close the workspace.
[](https://learninghub.primer-e.com/uploads/images/gallery/2024-07/screenshotpage165a.png)