# Align graphs automatically
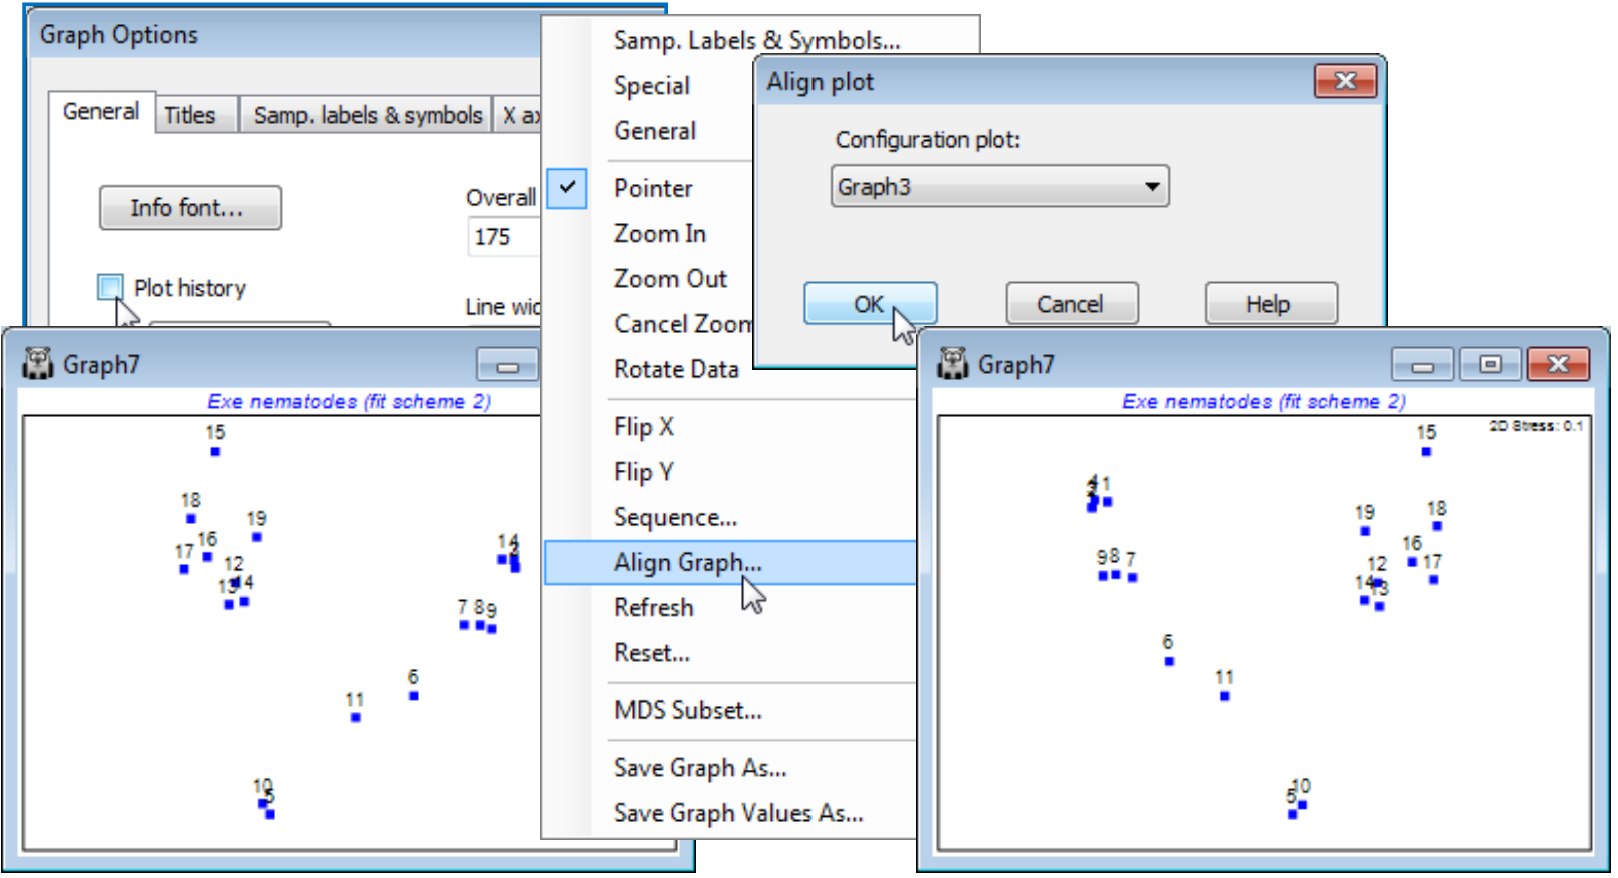
A new feature in PRIMER 7 is the ability to automatically reflect in the axes and rotate an MDS configuration (and rescale it, if necessary) such that it best matches the pattern of another supplied configuration. This can make it quicker and simpler to compare patterns from several different ordinations of the same sample labels, trying out the effect of different pre-treatments, resemblance measures or simply re-runs with more restarts etc. This is accomplished by Procrustes analysis (see the CiMC reference list for the Gower 1971 reference) and operates only on two graphs at a time. In the current Exe nematodes workspace Exe ws you should already have at least two 2-d *n*MDS plots for the 19 sites (e.g. Graph3 and Graph7 under Kruskal fit schemes 1 and 2). Automatically rotate and flip the active window (say Graph7) to match that of Graph3 by right-clicking over the plot (or taking **Graph**) to get **Align Graph**>(Configuration plot: Graph3). Note that the examples above and below have used the **General** and **Title** tabs on the Graph Options dialog to remove the history box (uncheck Plot History), amend main title, remove subtitle, change overall font scales etc. All these features and the **Samp. labels & symbols** tab are exactly as covered in Section [6](https://learninghub.primer-e.com/books/primer-v7-user-manual-tutorial/chapter/6-clustering-methods-cluster-simprof-unctree-krcluster).
[](https://learninghub.primer-e.com/uploads/images/gallery/2024-07/screenshotpage119a.png)