# Box plots & means plots for diversity indices
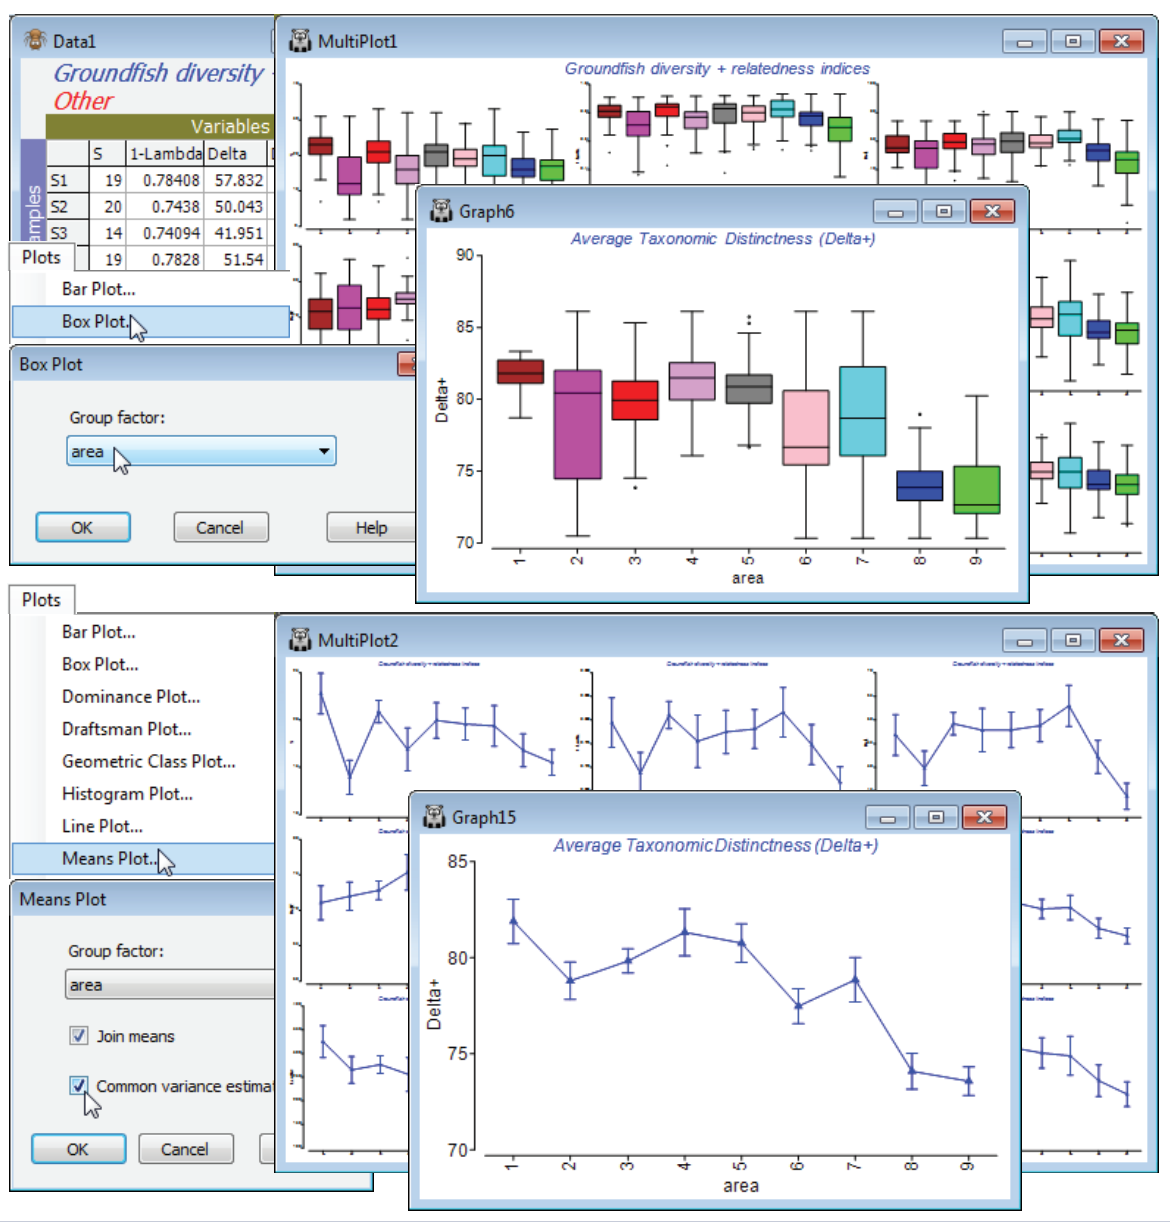
The sheet Data1 of this suite of diversity indices for each of the 277 samples, split into 9 sea areas (factor area), could now be input to two new multi-plot routines in PRIMER 7, namely standard univariate box plots and means plots, treating the sea areas (1: Bristol Channel, …, 9: E Central North Sea; see map Fig. 17.10 in CiMC) as a group structure, with an average of about 30 replicate sample boxes (quarter degree rectangles) within each sea area. Taking **Plots>Box Plot**>(Group factor: area) on Data1 gives 9 separate box plots, *Graph2* to *Graph10*, one for each diversity index in the above set, each with 9 ‘box and whiskers’ constructions, one for each area. These are placed into a multi-plot, *MultiPlot1*, and are intended as ‘quick look’ plots, with limited flexibility for manipulation (individual plots restricted to choice of axis scales, title content and text sizes). For Data1 again, **Plots>Means Plot**>(Group factor: area) & (✓Join means) & (✓Common variance estimate) gives a similar set of 9 plots within *MultiPlot2*, each of observed means and confidence intervals for the true mean of that particular diversity index for each of the 9 areas. There is choice of separate variance estimates for each area, or a common variance estimate (as from the ANOVA residual mean square). Interval widths for means vary here because areas have differing replication.
[](https://learninghub.primer-e.com/uploads/images/gallery/2024-11/screenshotpage273a.png)