# Bubble images
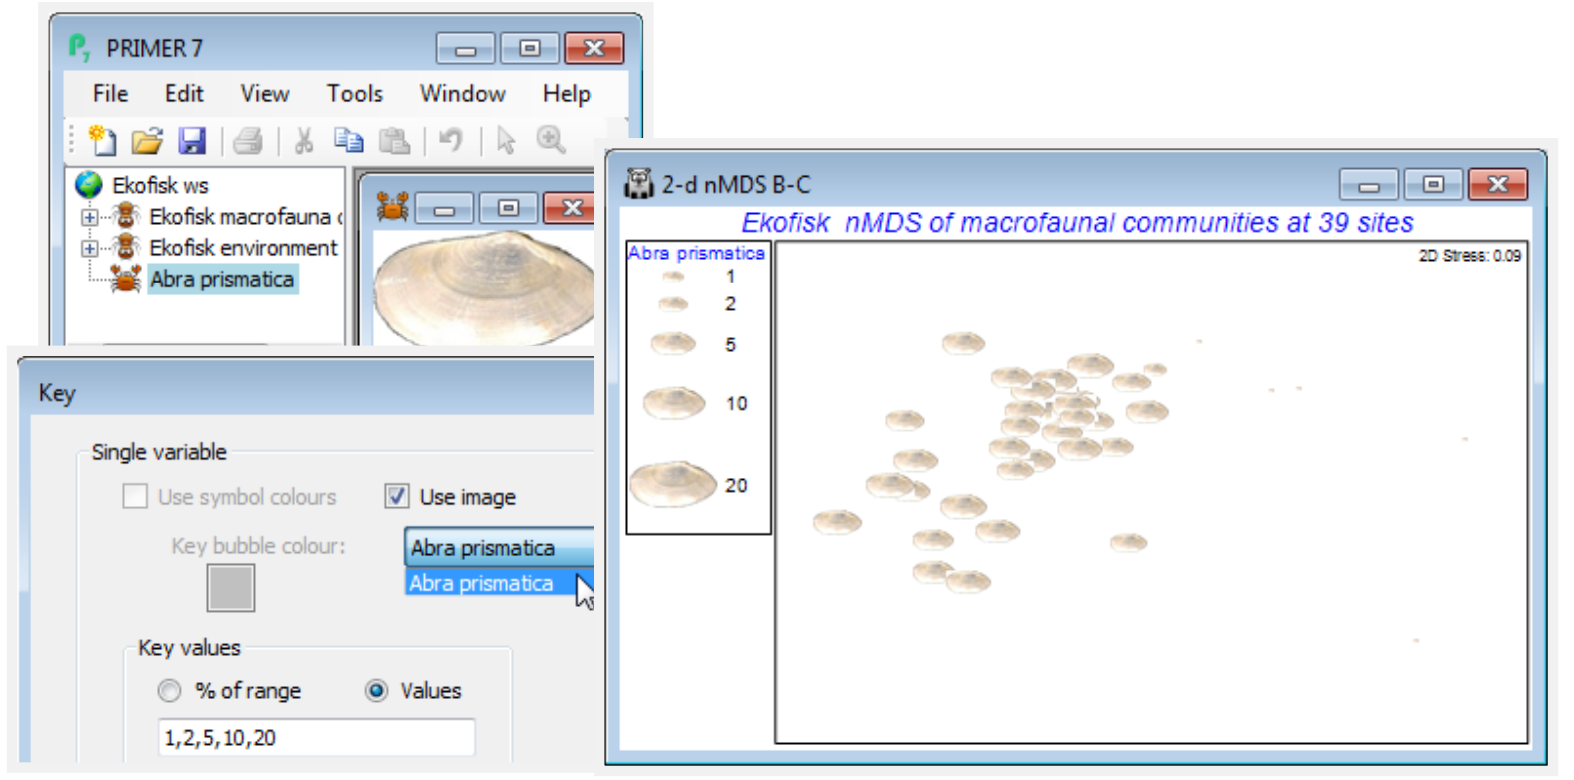
A further new option on this **Key** dialog is to replace single-coloured circles with a (rectangular) supplied image plotted at different sizes. To illustrate this, within the C:\Examples v7\Ekofisk macrofauna directory there is a photo image of a single valve of *Abra prismatica* as an \*.jpg file (at very low resolution in this case, though it could be much higher – avoid using an image of several Mb for this purpose, however, if you do not want to slow the MDS plotting noticeably). **File>Open** this, taking the file type as (Image file: \*.jpg, \*.jpeg, \*.png, \*.bmp, \*.tif, \*.gif, \*.emf). Take **Key** in the **Special>Main**>Bubble section, and (✓Use image>Abra prismatica), which only operates when (✓Use symbol colours) is unchecked. Whether such a graph is successful depends on the image – the plotted shapes are rectangles not circles (and fully opaque, whatever the opacity setting) so it may be most effective for ordinations with relatively few points.
[](https://learninghub.primer-e.com/uploads/images/gallery/2024-07/screenshotpage135a.png)