# Bubble plots in 3-d MDS; (W Australia fish diets)
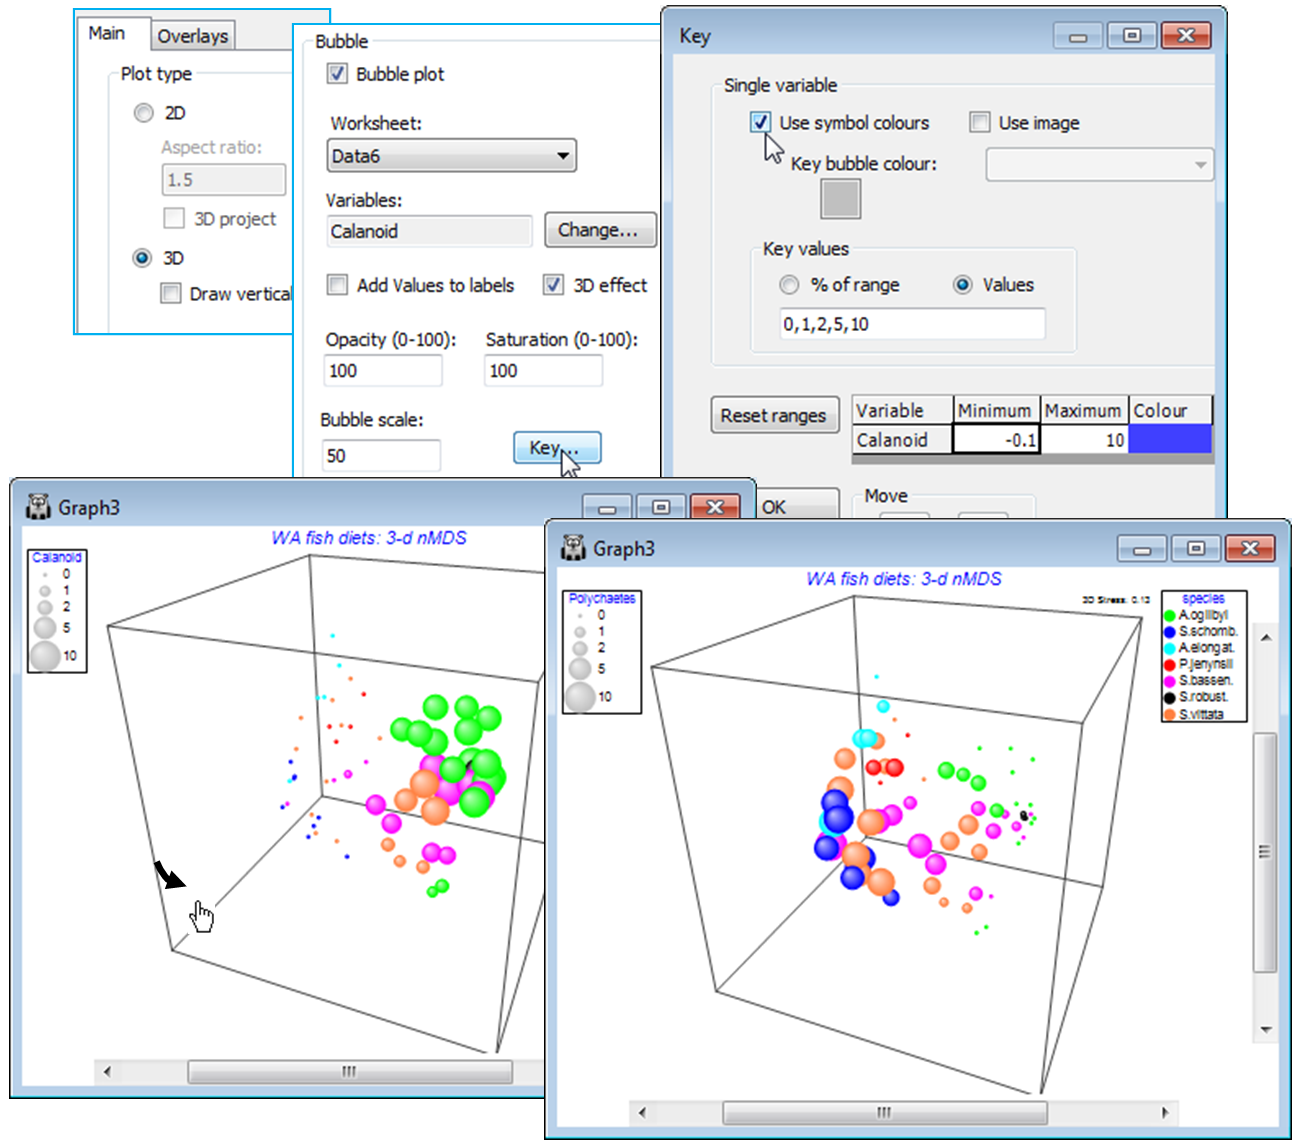
Another new feature in PRIMER 7 is the ability to construct bubble plots in 3-d ordinations, where the same ‘3-d effect’ representation of bubbles is employed as was seen earlier in 2-d plots – only now, of course, (✓3D effect) is the default. These are reasonably convincing as whole spheres, when the 3-d plot is rotated (as described earlier in this section), though inevitably less so as segmented bubble plots – though the latter plots are also permitted.
To demonstrate bubble plots in a case where a 3-d ordination was necessary, in order to reduce stress to acceptable levels, re-open the WA fish ws workspace used earlier in this section (to show spinning and digital recording of 3-d solutions). On the 3-d *n*MDS plot, Graph3, create individual bubble plots for the dietary constituents *Calanoid* and *Polychaetes*, using the secondary data for which samples have been standardised and then square root transformed (probably Data6).
[](https://learninghub.primer-e.com/uploads/images/gallery/2024-07/screenshotpage141a.png)