# Bubble plots on averages
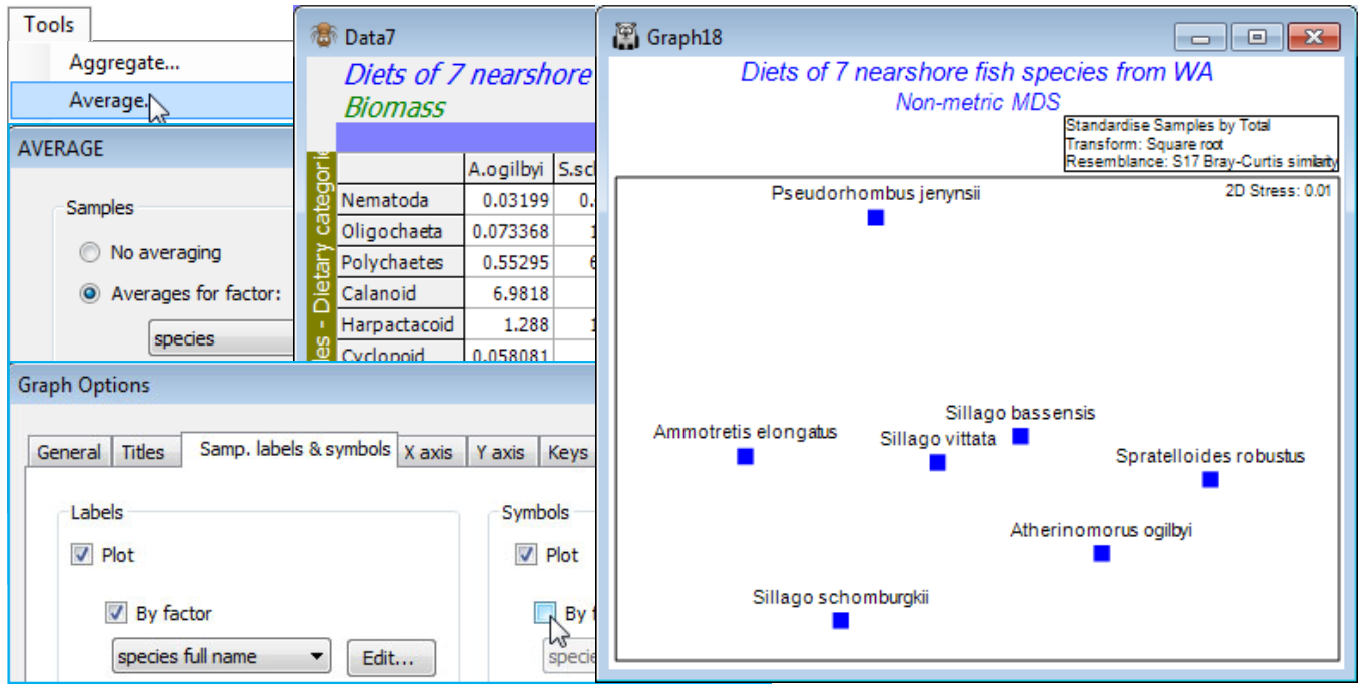
For these data, a segmented bubble plot on a 2-d ordination provides a succinct summary of the relative balance of the main dietary components for these 7 fish species, when examined on data averaged over all replicate gut samples for each fish species (as in Fig. 7.16 of CiMC). On Data6, the standardised then transformed data sheet, take **Tools>Average**>(Samples•Averages for factor: species), giving a matrix of 7 samples (the 7 fish species) by 32 dietary categories, Data7. Compute Bray-Curtis similarities on this and produce the 2-d *n*MDS configuration, which has minimal stress and is therefore an excellent representation of the dietary dissimilarities among the fish species. The *means plot* below labels by the full species name and harmonises the symbols to a blue square.
[](https://learninghub.primer-e.com/uploads/images/gallery/2024-07/screenshotpage141b.png)
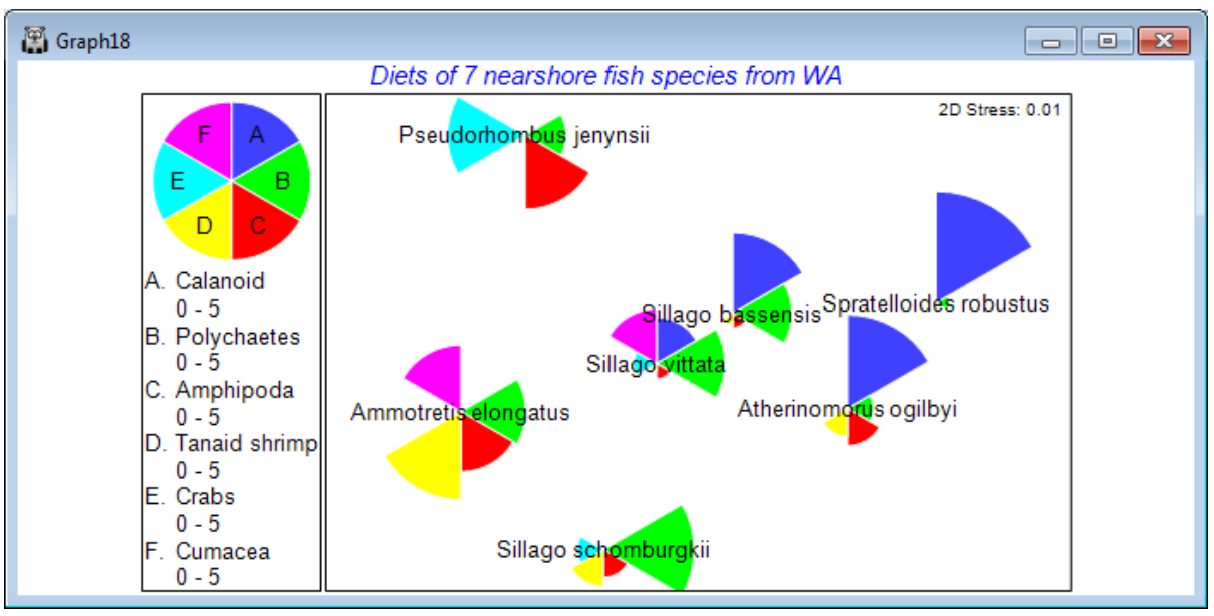
Now, uncheck the History box on the **General** menu, remove the subtitle from the **Titles** tab and turn this into a segmented bubble plot by **Special>Main**>✓Bubble plot>(Worksheet: Data7), and **Change** variables to *Calanoid (copepods)*, *Polychaetes*, *Amphipods*, *Tanaids*, *Crabs*, *Cumaceans*, also increasing the Bubble scale. On the **Key** dialog, set a uniform range of 0-5 (square root scale, so the segment sizes in the key will represent an average 25% of diet by volume), change Boundary colour to white and make any other desired colour changes. (If the names are required displaced from the bubble centres, or the key back-transformed to original units, key/titles moved etc., as in the equivalent Fig. 7.16 of CiMC for example, the plot can be copied and pasted to Powerpoint or other presentation software; this will be in vector not bitmap format so can readily be edited). Resave this fish diets workspace as WA fish ws for use in the next section, and close it.
[](https://learninghub.primer-e.com/uploads/images/gallery/2024-07/screenshotpage142a.png)