# Combining factors (e.g. to average)
With the Tasmania nematodes sheet active, open the Factors dialog with **Edit>Factors**. Combining factors (**Combine**) can be a quick and effective way of creating new factors or composite sample names in nested or crossed layouts. Firstly, though, it is usually useful to create a separator ‘factor’ (or perhaps more than one), by **Add**>(Add factor named: -), filling the column with dash symbols, by entering a dash in the first row, highlighting the factor and using **Fill>Value** again. **Combine** now displays a typical selection box (PRIMER uses a similar dialog for many other analyses, e.g. selecting a subset of the data by levels of a factor). Click on Blk and  , then - and Trt , to set up which factors are to be combined and in what order. (Note that the double arrows
 move all items from the (Available) list to the (Include) list, or back, and a selection of entries can be moved in one operation by holding the Ctrl key down as the items are clicked – or the Shift key to obtain a range of items – as in usual Windows practice). Pressing **OK** then gives a composite factor with name *Blk-Trt* and the 8 levels: B1-D, B2-D, …, B4-D, B1-U, …, B4-U, which are the 8 cells of the two factor crossed design, with two replicates at each level.
[](https://learninghub.primer-e.com/uploads/images/gallery/2024-05/screenshotpage40a.png)
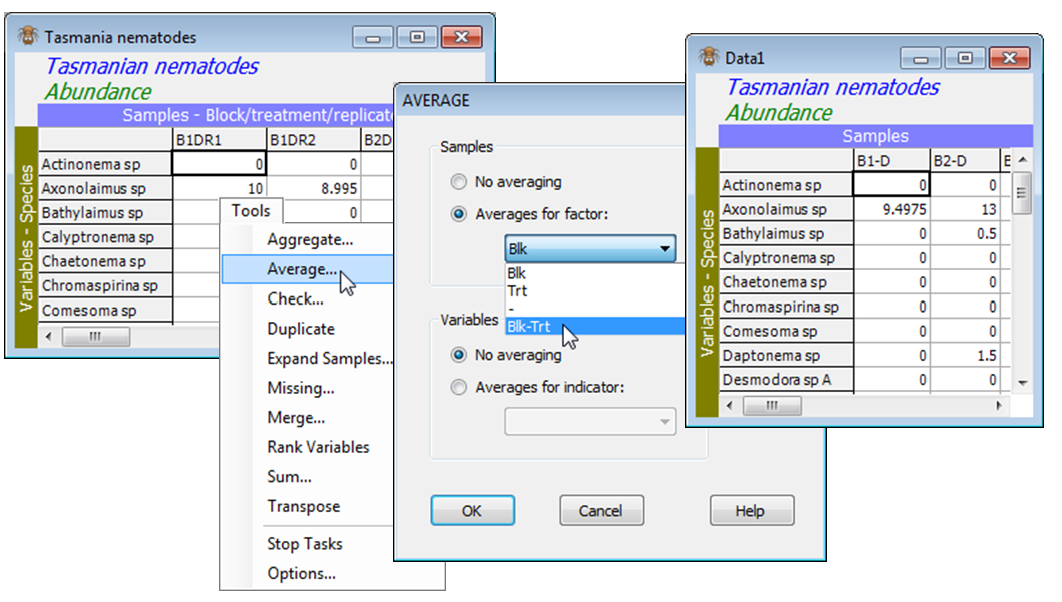
Such a combined factor has several uses, e.g. it can be a composite label on an ordination plot, and it is essential for averaging over the replicates in the data, to obtain a matrix of mean values, for each of the 8 block $\times$ treatment combinations here. This is simply achieved with an **OK** for all the changes you have made to the Factor information, and then **Tools>Average**>(Samples•Averages for factor: Blk-Trt) & (Variables•No averaging). This creates a new data sheet, Data1, in which the sample labels are the levels of the combined *Blk-Trt* factor, as seen above (B1-D, B2-D, etc). It also carries across what factor information it can from the original sheet (take **Edit>Factors** on Data1), though a factor for which different levels have been averaged over will have ‘Undefined!’ entries (e.g. produce averages for factor *Trt*, and the *Blk* factor entries would all be undefined, naturally).
[](https://learninghub.primer-e.com/uploads/images/gallery/2024-05/screenshotpage41a.png)
move all items from the (Available) list to the (Include) list, or back, and a selection of entries can be moved in one operation by holding the Ctrl key down as the items are clicked – or the Shift key to obtain a range of items – as in usual Windows practice). Pressing **OK** then gives a composite factor with name *Blk-Trt* and the 8 levels: B1-D, B2-D, …, B4-D, B1-U, …, B4-U, which are the 8 cells of the two factor crossed design, with two replicates at each level.
[](https://learninghub.primer-e.com/uploads/images/gallery/2024-05/screenshotpage40a.png)
Such a combined factor has several uses, e.g. it can be a composite label on an ordination plot, and it is essential for averaging over the replicates in the data, to obtain a matrix of mean values, for each of the 8 block $\times$ treatment combinations here. This is simply achieved with an **OK** for all the changes you have made to the Factor information, and then **Tools>Average**>(Samples•Averages for factor: Blk-Trt) & (Variables•No averaging). This creates a new data sheet, Data1, in which the sample labels are the levels of the combined *Blk-Trt* factor, as seen above (B1-D, B2-D, etc). It also carries across what factor information it can from the original sheet (take **Edit>Factors** on Data1), though a factor for which different levels have been averaged over will have ‘Undefined!’ entries (e.g. produce averages for factor *Trt*, and the *Blk* factor entries would all be undefined, naturally).
[](https://learninghub.primer-e.com/uploads/images/gallery/2024-05/screenshotpage41a.png) , then -
  move all items from the (Available) list to the (Include) list, or back, and a selection of entries can be moved in one operation by holding the Ctrl key down as the items are clicked – or the Shift key to obtain a range of items – as in usual Windows practice). Pressing **OK** then gives a composite factor with name *Blk-Trt* and the 8 levels: B1-D, B2-D, …, B4-D, B1-U, …, B4-U, which are the 8 cells of the two factor crossed design, with two replicates at each level.
[](https://learninghub.primer-e.com/uploads/images/gallery/2024-05/screenshotpage40a.png)
Such a combined factor has several uses, e.g. it can be a composite label on an ordination plot, and it is essential for averaging over the replicates in the data, to obtain a matrix of mean values, for each of the 8 block $\times$ treatment combinations here. This is simply achieved with an **OK** for all the changes you have made to the Factor information, and then **Tools>Average**>(Samples•Averages for factor: Blk-Trt) & (Variables•No averaging). This creates a new data sheet, Data1, in which the sample labels are the levels of the combined *Blk-Trt* factor, as seen above (B1-D, B2-D, etc). It also carries across what factor information it can from the original sheet (take **Edit>Factors** on Data1), though a factor for which different levels have been averaged over will have ‘Undefined!’ entries (e.g. produce averages for factor *Trt*, and the *Blk* factor entries would all be undefined, naturally).
[](https://learninghub.primer-e.com/uploads/images/gallery/2024-05/screenshotpage41a.png)
move all items from the (Available) list to the (Include) list, or back, and a selection of entries can be moved in one operation by holding the Ctrl key down as the items are clicked – or the Shift key to obtain a range of items – as in usual Windows practice). Pressing **OK** then gives a composite factor with name *Blk-Trt* and the 8 levels: B1-D, B2-D, …, B4-D, B1-U, …, B4-U, which are the 8 cells of the two factor crossed design, with two replicates at each level.
[](https://learninghub.primer-e.com/uploads/images/gallery/2024-05/screenshotpage40a.png)
Such a combined factor has several uses, e.g. it can be a composite label on an ordination plot, and it is essential for averaging over the replicates in the data, to obtain a matrix of mean values, for each of the 8 block $\times$ treatment combinations here. This is simply achieved with an **OK** for all the changes you have made to the Factor information, and then **Tools>Average**>(Samples•Averages for factor: Blk-Trt) & (Variables•No averaging). This creates a new data sheet, Data1, in which the sample labels are the levels of the combined *Blk-Trt* factor, as seen above (B1-D, B2-D, etc). It also carries across what factor information it can from the original sheet (take **Edit>Factors** on Data1), though a factor for which different levels have been averaged over will have ‘Undefined!’ entries (e.g. produce averages for factor *Trt*, and the *Blk* factor entries would all be undefined, naturally).
[](https://learninghub.primer-e.com/uploads/images/gallery/2024-05/screenshotpage41a.png)