# Correlation as similarity
Use of a correlation matrix between all pairs of variables as input to a multivariate ordination (say), in which points denote variables rather than samples (so that highly correlated variables are placed close together), either requires one of the absolute coefficients or a simple shift $S = 50(1+\rho)$ of the three standard coefficients, so that they are defined over (0, 100) rather than (–1, 1). There is an important difference between the two approaches: should highly negatively correlated variables be considered highly similar (use an absolute measure) or highly dissimilar (shift the scale upwards)? The practical context should usually make clear which is the right choice.
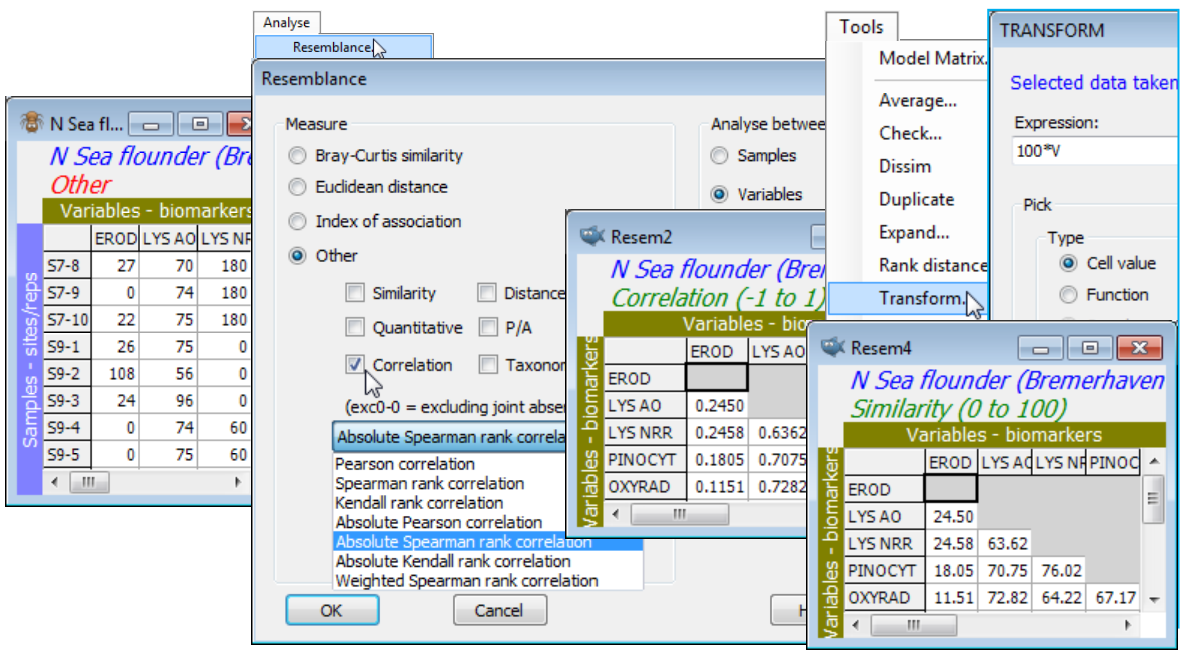
Save and close the current Europe groundfish workspace (as Groundfish ws), and open that for the N Sea biomarkers N Sea ws, created towards the end of Section [4](https://learninghub.primer-e.com/books/primer-v7-user-manual-tutorial/chapter/4-pre-treatment-options) – see there for description of the variables. (If not available, just open N Sea flounder biomarkers(.pri) from directory C:\Examples v7\N Sea biomarkers). The previous pre-treatment by *variability weighting* of these (transformed) biomarkers was designed for calculation of standard sample similarities (which you may now wish to do by **Analyse>Resemblance**>(Measure•Euclidean distance) & (Analyse between•Samples)), but the reason for re-opening this workspace now is to calculate similarities among variables, via correlation. The choice is between standard (Pearson) correlation and a rank-based correlation (Spearman, say); if the analysis includes the categorical as well as the continuous variables, the rank option may be preferred. Note that any variability weighting previously carried out, to weight the biomarkers against each other in calculating sample similarities, will be irrelevant to correlation computation of variable similarities, because variables are renormalised (under Pearson) or ranked (under Spearman). For Spearman, even the square root transform applied to the EROD and Lipid variables is irrelevant, since this will not change the rank order of variable values across samples. Note that low lysosomal stability (AO or NRR) is associated with high EROD etc. – both indicating contaminant impact – so an absolute correlation measure is used to capture biomarker similarities. **Analyse>Resemblance>**(Measure•Other>✓Correlation: Absolute Spearman rank correlation) & (Analyse between•Variables) on N Sea flounder biomarkers will produce values in the range (0,1). These could be scaled to (0,100) using **Tools>Transform**>(Expression:100*V) – see box heading Transform on resemblances in Section [11](https://learninghub.primer-e.com/books/primer-v7-user-manual-tutorial/chapter/11-general-data-manipulation-tools-further-pre-treatment) – and the Type changed from Correlation to Similarity with **Edit>Properties**>(Resemblance type•Similarity) but this is not practically necessary for most routines in PRIMER, such as nMDS ordination, since only ranks of the resemblances are used.
[](https://learninghub.primer-e.com/uploads/images/gallery/2024-06/screenshotpage80a.png)