# Dissimilarity preservation as a matrix correlation
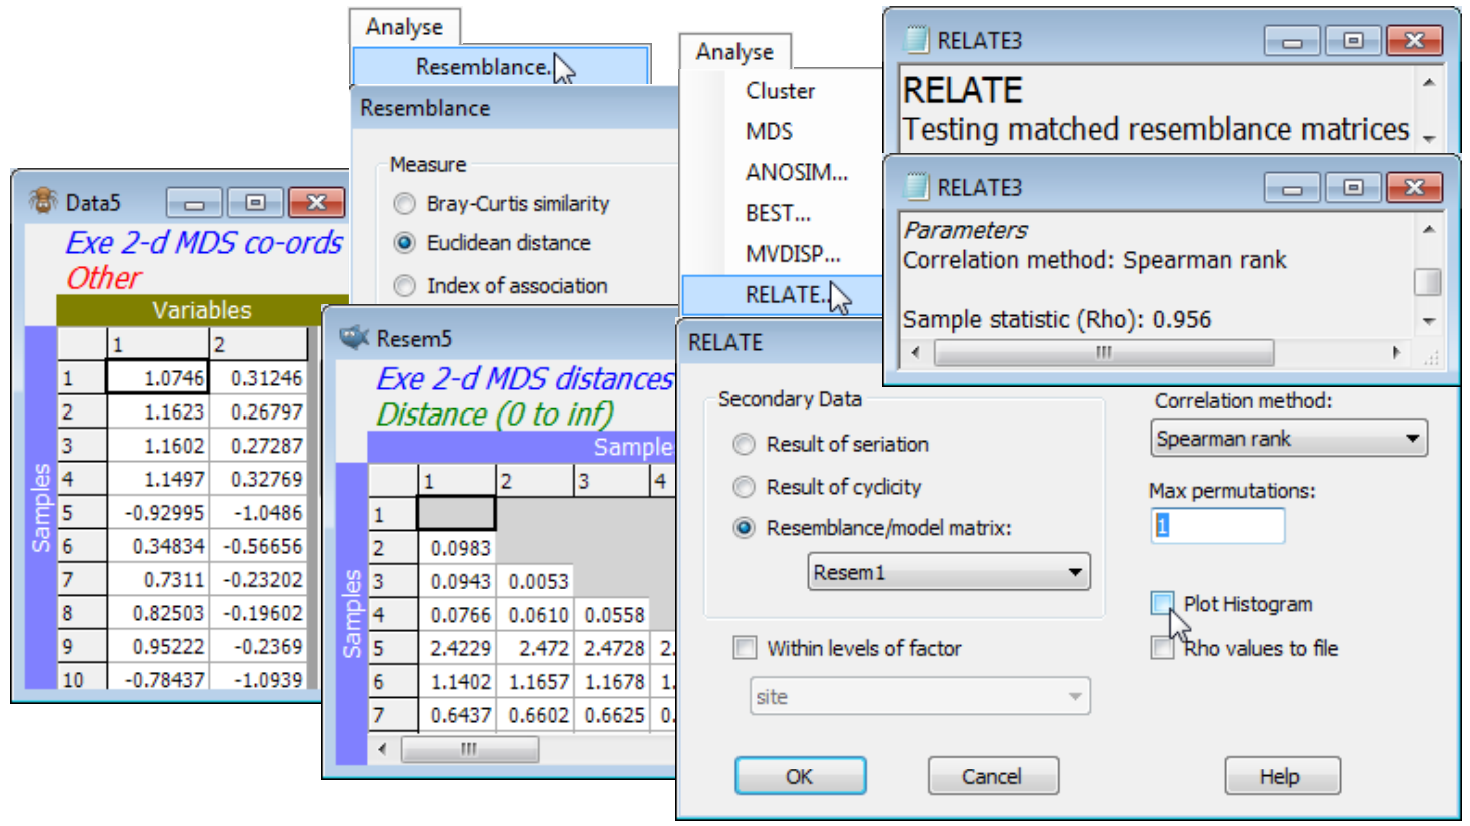
One can also ask how well the (Euclidean) distances among points in the *n*MDS plot correlate with the dissimilarities in the resemblance matrix. The former are calculated by running the ordination co-ordinates (output to Data4 and Data5 by the ✓Ordinations to worksheet instruction in the above example) through **Analyse>Resemblance**>(•Euclidean distance). Then, just as for the Cophenetic correlation heading in the Section [6](https://learninghub.primer-e.com/books/primer-v7-user-manual-tutorial/chapter/6-clustering-methods-cluster-simprof-unctree-krcluster) cluster analyses, which was carried out on the same Exe data, a matrix correlation between these two triangular matrices requires a run of the **Analyse>RELATE** routine (Section [14](https://learninghub.primer-e.com/books/primer-v7-user-manual-tutorial/chapter/14-further-matching-of-multivariate-patterns-relate-2stage-best-mvdisp)), e.g. with the distance matrix as the active sheet and the dissimilarities Resem1 as the secondary data (or vice-versa). The only difference this time is that the option to compute a rank correlation such as Spearman should be taken (a *rank Mantel*-type correlation), since this is *n*MDS and the Shepard plot is not linear. (It is often overlooked that Pearson correlation measures only linearity of a relationship – a stress of zero corresponds to Spearman $\rho_S$= 1 but Pearson $\rho$< 1, when the increasing relationship is perfect but not linear). The permutation test in RELATE is not required since $\rho$= 0 is not a sensible null hypothesis, so set Max permutations: 1 and uncheck the Plot Histogram box, giving $\rho_S$= 0.956 for the 2-d *n*MDS and 0.965 for the 3-d configuration.
[](https://learninghub.primer-e.com/uploads/images/gallery/2024-06/screenshotpage116b.png)