# Duplicate graphs
*Abra prismatica* appears to be a species which can tolerate the contaminant or disturbance effects found relatively close to the oilfield since the plot shows that it is present in consistent numbers from sites 8km distant to those >250m – remember mentally to square up numbers in the bubble key’s square root scale, or replot the ordination using the original matrix as the secondary data, (Bubble>Worksheet: Ekofisk macrofauna counts), rather than the Square root sheet. Either matrix is perfectly valid to use as bubble sizes but the interpretation is different. The above graph places the focus on how the species contributes to the ordination pattern, whereas superimposing raw data is a valid way of seeing how the actual counts vary from site to site. To examine a range of species contributions, firstly revert to the bubble plot at the bottom of the previous page – by unchecking (Use image) on the **Key** dialog – and take **Tools>Duplicate**>(•On existing branch) on this plot, three times. Then **Window>Close All Windows**, re-display the four plots by clicking on them in the Explorer tree, and **Window>Tile Vertical** – the example below also suppresses the Explorer tree using the **View** menu. (You could alternatively put all four plots into a new multiplot).
On the first copy, use **Special>Main**>Bubble>**Change**, taking *Montacuta substriata* over to the Include box and *Abra prismatica* back to Available. On **Key**, change its colour to blue (if needed), and again its Minimum to -0.1 and Maximum to 20. Note that if you change the variable plotted as bubbles, the routine automatically rescales to a value for the maximum bubble which is relevant for that new variable. We may often need this rescaling when plotting actual counts, since one or two species could be dominant and a universal abundance scale then reduces most species to invisible bubbles (the reason for transforms in multivariate analysis!). Separate scaling would also be needed for abiotic variables superimposed as bubbles on a community ordination, since there is then no common measurement scale – see later. But when the focus is on judging relative contributions different species make to the observed community gradient (as here), a common transformed scale is needed, so the min and max values of -0.1 and 20 need to be set for each copy of the MDS plot. (If you ever need to reset to default ranges for variables, use **Reset ranges** on the Key dialog). Now **Change** the second copy of the plot to *Pholoe inornata* and green bubbles, and the final copy to *Chaetozone setosa* and purple bubbles, and note the very different patterns across the gradient.
[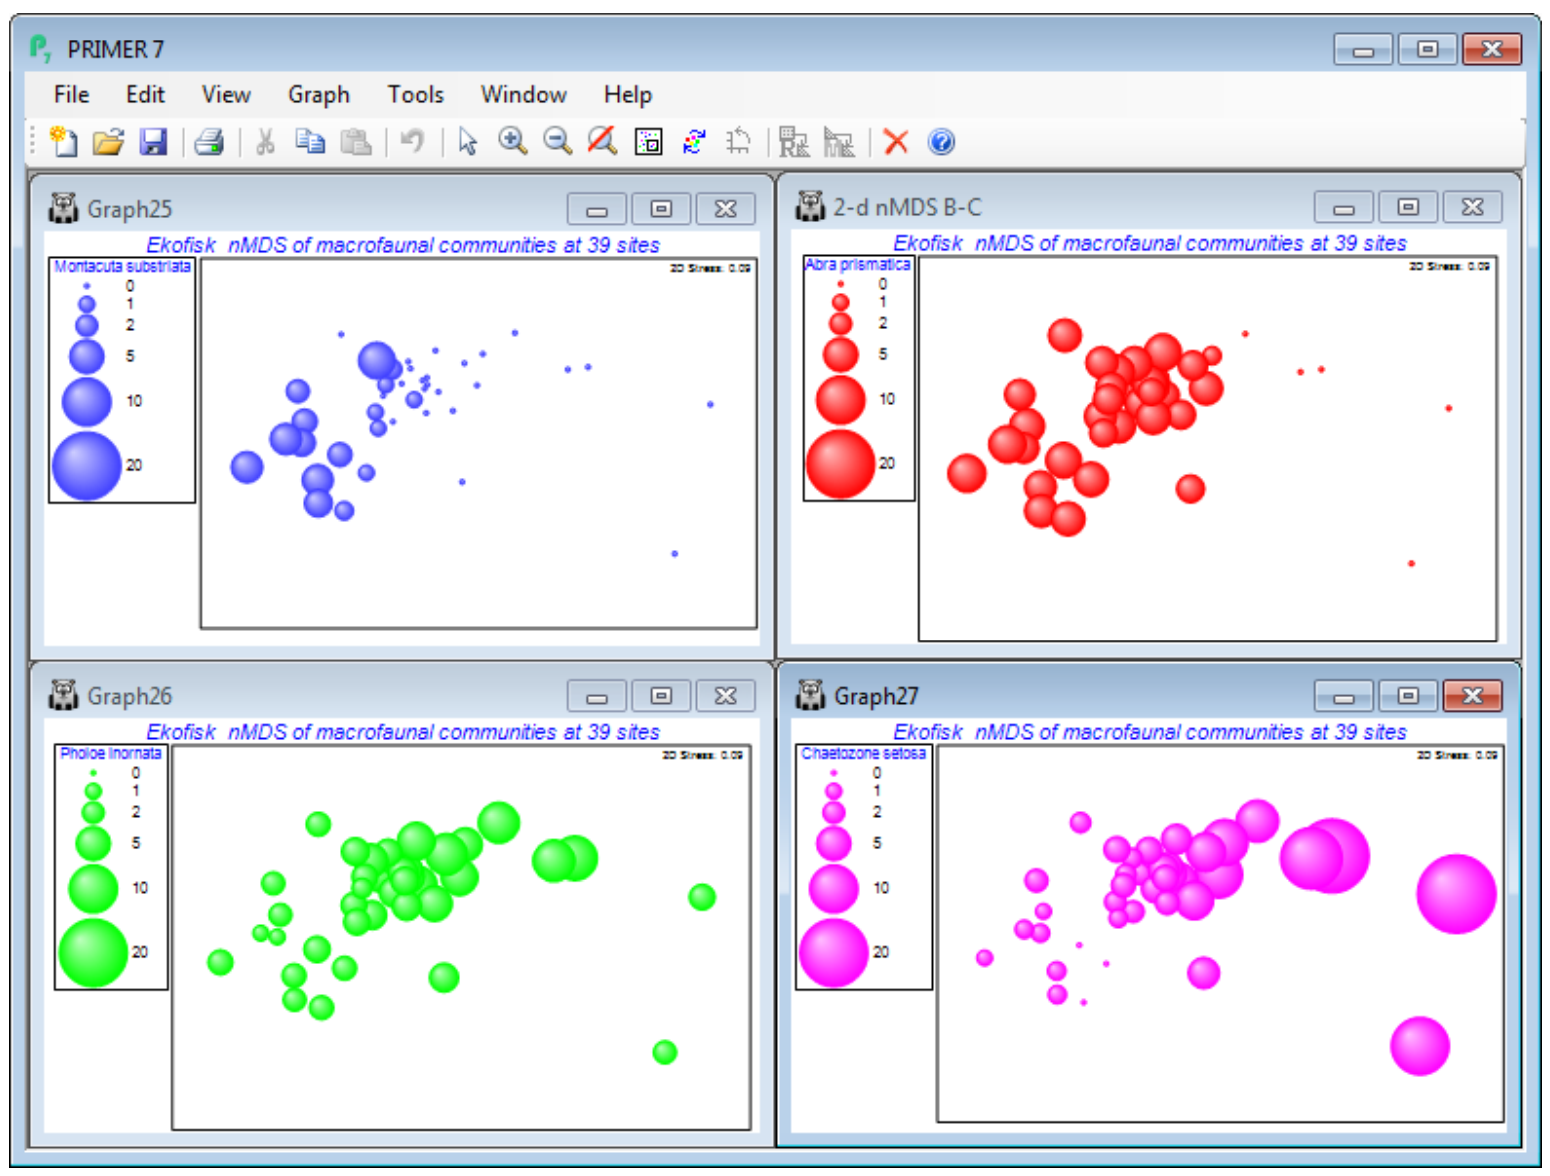](https://learninghub.primer-e.com/uploads/images/gallery/2024-07/screenshotpage136a.png)
Bubble plots are usually clear and interpretation straightforward – however, there are 174 species here, many of which will show no pattern across the sites or will have such low numbers (seen in negligible-sized bubbles on this common scale) that they can contribute little to the site similarities. (An example is seen for these data in CiMC Fig. 7.13 for *Spiophanes bombyx*). Having established by hypothesis testing that there are meaningful community patterns (e.g. ANOSIM, Section [9](https://learninghub.primer-e.com/books/primer-v7-user-manual-tutorial/chapter/9-analysis-of-similarity-tests-unordered-and-ordered-anosim), on the distance groups, or RELATE, Section [14](https://learninghub.primer-e.com/books/primer-v7-user-manual-tutorial/chapter/14-further-matching-of-multivariate-patterns-relate-2stage-best-mvdisp)), to justify interpreting species patterns, one can avoid having to plot all 174 bubble plots(!) by examining Shade Plots and SIMPER results (Section [10](https://learninghub.primer-e.com/books/primer-v7-user-manual-tutorial/chapter/10-wizards-and-species-analyses-basic-mva-coherence-plots-matrix-display-simper)), to pick out species for which bubble plots will be worthwhile.