# Editing plot titles & scales
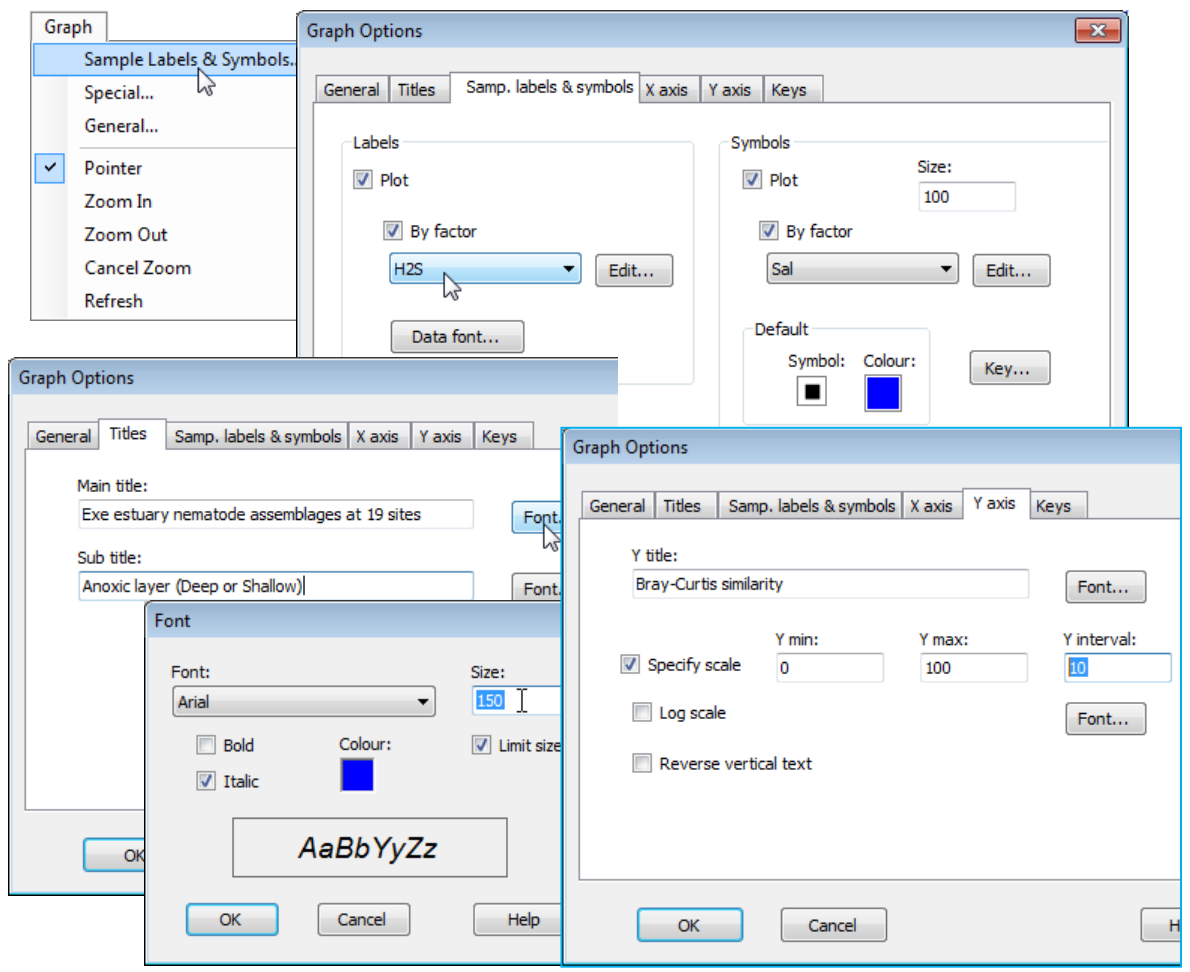
Still in the Graph Options dialog box, take the **Titles** tab and edit the main and sub-title content as shown below, also altering title font sizes and types: (Main title:**Font**>Size:150) & (Sub title:**Font**> Colour:\[choose black] & \[Italic check box off]). From the **Y axis** tab, change title: (Y title: Bray-Curtis similarity), also respecifying the y axis scale by (✓Specify scale)>(Y interval:10). On the **X axis** tab, take (✓Reverse vertical text).
[](https://learninghub.primer-e.com/uploads/images/gallery/2024-06/screenshotpage86a.png)