# (Exe estuary nematodes)
Assemblage data on 140 species of free-living marine nematodes at 19 sites (labelled 1-19) in the inter-tidal soft sediments of the Exe estuary, UK, is in data file C:\Examples v7\Exe nematodes\ Exe nematode abundance(.pri); the entries are averaged counts over 6 bi-monthly samples in one year. An analysis of the full data, Exe nematodes bi-monthly(.pri) suggests that seasonality must be relatively weak, if present – see CiMC Fig. 6.12 – and this example is mainly used here, and in CiMC, in its time-averaged form. The file Exe environmental(.pri) contains six environmental variables for the sediments at those 19 sites: median particle diameter, depth of the water table, depth of the anoxic layer, height up the shore, % organics and interstitial salinity. The field study is described in Warwick RM 1971, *J Mar Biol Assoc UK* 51: 439-454 and the original multivariate data analysis in Field JG, Clarke KR, Warwick RM 1982, *Mar Ecol Prog Ser* 8: 37-52.
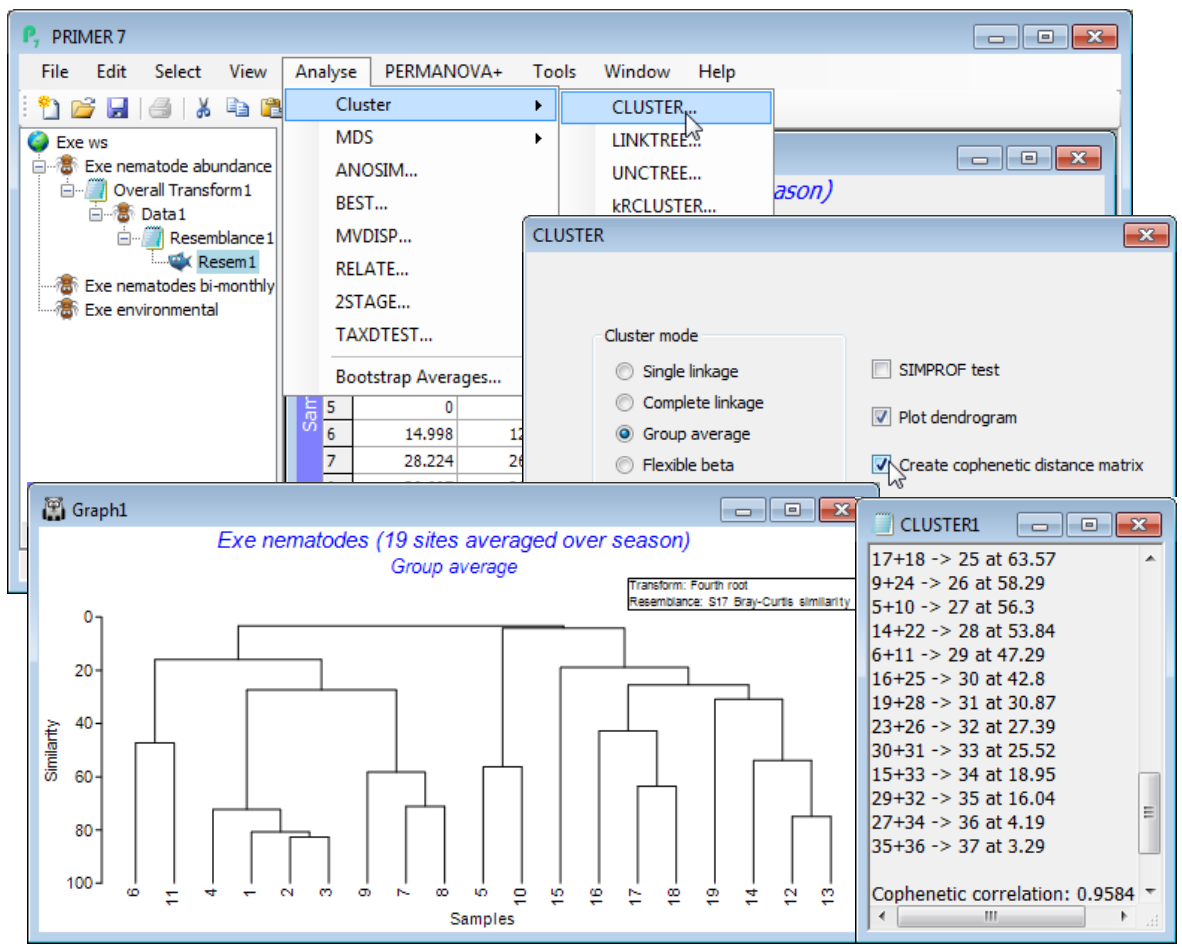
Open Exe nematode abundance, pre-treating the samples with a fourth-root transform (Section [4](https://learninghub.primer-e.com/books/primer-v7-user-manual-tutorial/chapter/4-pre-treatment-options)), and calculating Bray-Curtis resemblances between samples (Section [5](https://learninghub.primer-e.com/books/primer-v7-user-manual-tutorial/chapter/5-resemblance-similarities-dissimilarities-and-distances)). With the latter as the active window, enter the clustering routine, taking **Analyse>Cluster>CLUSTER**>(Cluster mode•Group average) & (✓Plot dendrogram) & (✓Create cophenetic distance matrix), but not the SIMPROF test option for now. (Of course ✓Plot dendrogram would almost always be required).
[](https://learninghub.primer-e.com/uploads/images/gallery/2024-06/screenshotpage84a.png)