# ‘Fix collapse’ in nMDS; (Ko Phuket transects of coral reefs)
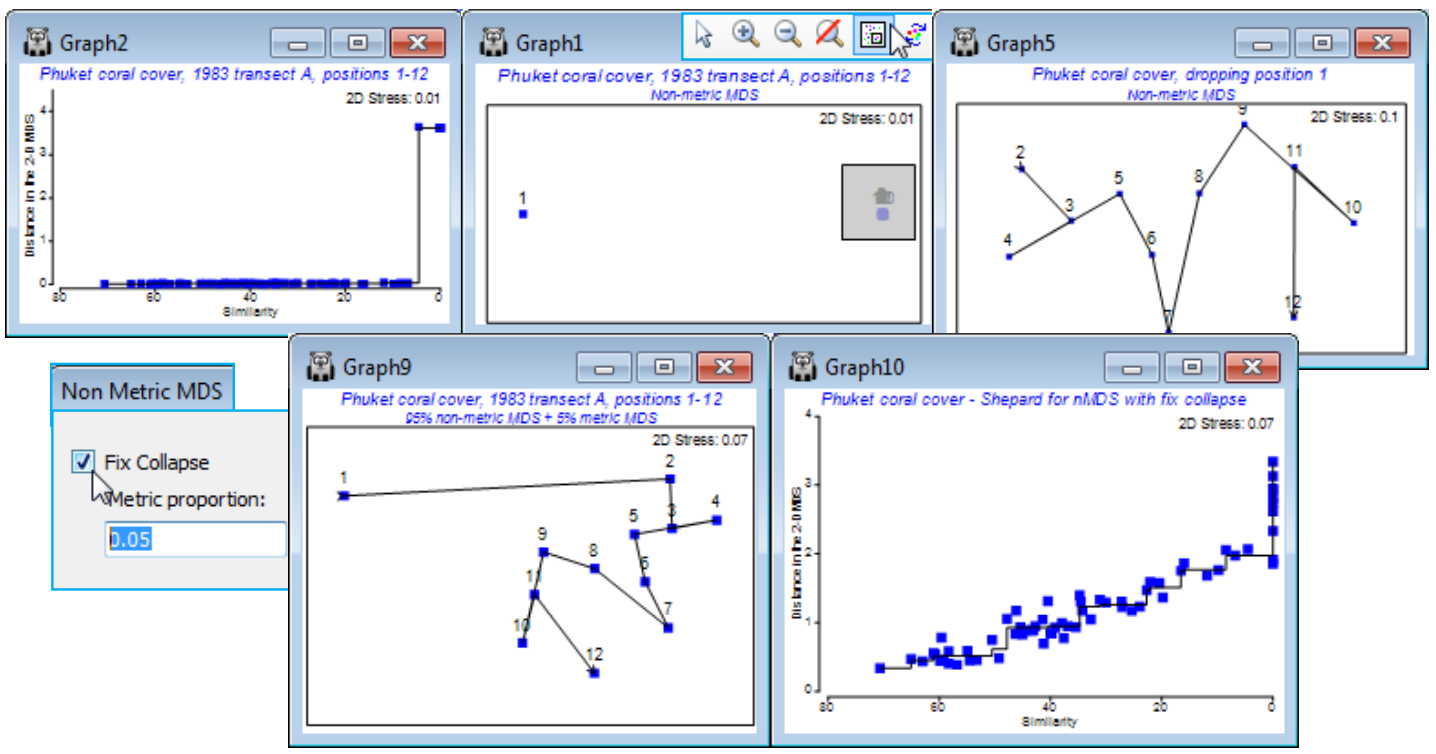
The PRIMER 7 *n*MDS dialog box includes a new option to (✓Fix Collapse). This addresses the problem of indeterminacy in some *n*MDS plots, when two (or more) groups of samples have very different communities, such that all dissimilarities between the groups are larger than any of the dissimilarities within groups. There might then not be sufficient constraints in the rank information for *n*MDS to be able to locate these two groups in relation to each other. The two groups must be placed at least far enough apart to make their nearest neighbours further away from each other than the furthest neighbour distance within groups. But moving the groups further apart still, whilst keeping their internal layouts the same, may satisfy all the rank orders in the resemblance matrix in just the same way. In the successive steps of an *n*MDS iteration, the groups are gradually placed at ever increasing distance to each other, so the outcome is convergence to a two point solution where each group has collapsed to a point. The groups can be ordinated separately, having drawn a box around each, by **Graph>MDS Subset** (or sometimes just one box if, as below, the plot splits into a single outlying sample and the remaining points). But a better solution is to recognise that while *n*MDS has no measurement scale to determine the relative placing of the two groups, *m*MDS does (e.g. if the average dissimilarity between the two groups is 80% and the maximum within groups is 40%, the nearest neighbours between groups are placed at approximately twice the distance of the furthest neighbours within groups). It is not necessary to throw away all the flexibility of an *n*MDS, in capturing the within-group structures, by moving entirely to *m*MDS – the better solution is to use a mixture of the two stress functions. The default, if the (✓Fix Collapse) option is selected in *n*MDS, is to mix only 5% of metric stress with 95% non-metric stress: (Metric proportion: 0.05). The result does not appear to be at all sensitive to the choice of this proportion; all the *n*MDS needs is just enough information from the resemblance scale to fix the relative placing of the groups.
Live cover of a coral reef assemblage was recorded from ‘plotless line-samples’ (of 10m length) perpendicular to, and at 10m spacing along an onshore-offshore transect (A) at Cape Panwa, Ko Phuket, Thailand. (Samples taken in 1983-88 are described in Clarke KR, Warwick RM & Brown BE 1993, *Mar Ecol Prog Ser* 102). We shall meet these data more extensively later, but for now, open Phuket coral cover 83-87.pri in C:\Examples v7\Phuket corals, and select only the first year of sampling, 1983 (**Select>Samples**, as seen on the previous page, on the Year factor). Transform by square root and take Bray-Curtis resemblances of this 12-point transect (factor Position). An *n*MDS without the (✓Fix Collapse) option is seen to collapse to a single point (position 1, closest to the shore) and the remaining points – note in the Shepard diagram that a major step or steps like this always indicate a degenerate solution. An **MDS Subset** could be performed on positions 2-12, as shown below, but repeating all 12 points in an *n*MDS with the (✓Fix Collapse) option gives a more satisfactory (and low stress) Shepard diagram and a better description. The serial change in coral communities over the positions is best seen by **Graph>Special>Overlays**>(✓Overlay trajectory).
[](https://learninghub.primer-e.com/uploads/images/gallery/2024-07/screenshotpage149a.png)
Save the workspace as Phuket ws for use in Section [9](https://learninghub.primer-e.com/books/primer-v7-user-manual-tutorial/chapter/9-analysis-of-similarity-tests-unordered-and-ordered-anosim), and close it.