# Linkage by flexible beta method
There are four possible Cluster mode choices within the **Analyse>Cluster>CLUSTER** dialog box, distinguished by the way they redefine the among-group dissimilarities at each proposed step of the agglomerative process. The *linkage options* are: •Single (/nearest neighbour) linkage, which has a tendency to produce unhelpful ‘chaining’ of groups, with many steps adding just a single sample to an existing group; •Complete (/furthest neighbour) linkage, which tends to have the opposite ‘over-grouped’ effect; •Group average (Unweighted Pair Group Method with Arithmetic mean UPGMA) which is the option shown in all the above plots and is widely used; and •Flexible beta, introduced by Lance GN & Williams WT 1967, *Comp J* 9: 373-380, a generalisation of a WPGMA method in which a range of options is controlled by choice of a parameter $\beta$. Chapter 3 of CiMC gives precise definitions of all these options, e.g. for flexible beta see the footnote on p3-4. Choice of $\beta$ is made automatically to maximise the *cophenetic correlation* $\rho$ (rho) between the dissimilarities/distances in the resemblance matrix and distances through the dendrogram between the matching pairs of samples – this idea was met near the beginning of this section – and a plot of $\rho$ vs. $\beta$ displayed.
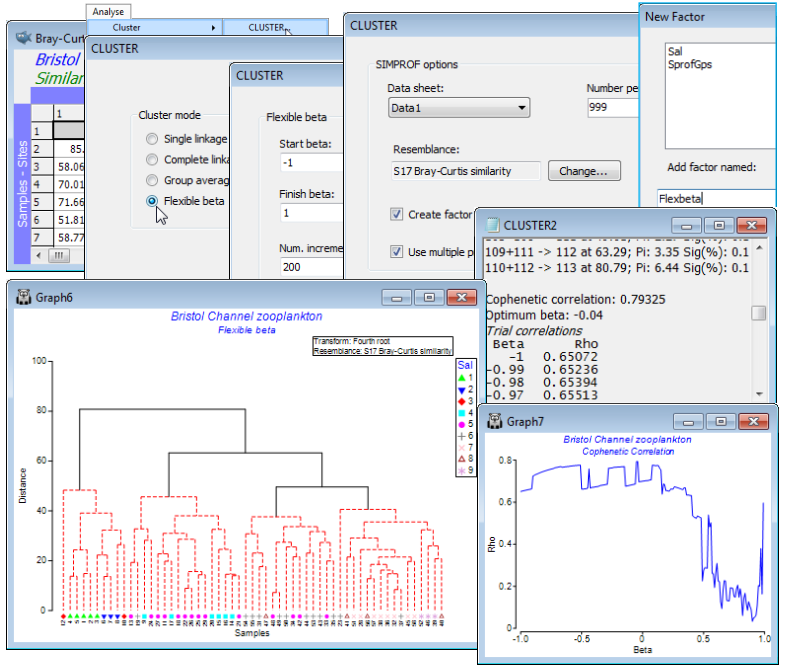
Remove the selection on the fourth-root transformed data matrix Data1, by **Select>All** (and **Edit> Clear Highlight**, though this is not essential) then with the active sheet as the similarity matrix calculated from Data1, take **Analyse>Cluster>CLUSTER**>(✓SIMPROF test) & (Cluster mode• Flexible beta)>(Start beta: -1) & (Finish beta: 1) & (Num. increments: 200). These are the defaults, meaning that the cophenetic correlation is computed and graphed for $\beta$ in increments of 0.01, with the optimum $\beta$ (maximum $\rho$) given in the Cluster results window, and this value used to calculate the dendrogram. Note that $\beta$ does need to be in the range (–1, 1) but negative values (or zero) make better sense theoretically, as is seen here in the line plot of the cophenetic correlation $\rho$ vs. $\beta$, so there is a case for restricting to (Start beta: -1)&(Finish beta: 0)&(Num. increments: 100). If a fixed value of $\beta$ is preferred (Lance & Williams suggest $\beta$= –0.25), as it might be for repeated clustering, then take, for example (Start beta: -0.25)&(Finish beta: -0.25)&(Num. increments: 1). You will also need to specify a factor for the SIMPROF groups, e.g. Add factor named: Flexbeta, which gives a Multi-plot (see next section) of the dendrogram and the line plot of $\rho$ vs. $\beta$.
[](https://learninghub.primer-e.com/uploads/images/gallery/2024-06/EECscreenshotpage96a.png)