# Other tree diagrams & SIMPROF (Bristol Ch. zooplankton)
For the final example of the options in shade plot, save and close Exe ws and return to the Bristol Channel ws used extensively in Section [6](https://learninghub.primer-e.com/books/primer-v7-user-manual-tutorial/chapter/6-clustering-methods-cluster-simprof-unctree-krcluster) to illustrate different clustering methods (and seen again in Section [7](https://learninghub.primer-e.com/books/primer-v7-user-manual-tutorial/chapter/7-managing-the-workspace-and-plotting-window-file-view-multi-plot-plots) – and [8](https://learninghub.primer-e.com/books/primer-v7-user-manual-tutorial/chapter/8-multi-dimensional-scaling-non-metric-nmds-metric-mmds-combined-mds), for MDS bubble plots). If not available, open BC zooplankton density in C:\ Examples v7\BC zooplankton, fourth-root transform it, calculate Bray-Curtis similarities BC resem and on this, run an unconstrained binary divisive clustering: **Analyse>Cluster>UNCTREE**>(Min group size: 1) & (Min split size: 4) & (Number of restarts: 50) & (Min split R: 0) & (✓SIMPROF test) & (Vertical positions•A%), and take defaults on the SIMPROF dialog, adding factor name Unctree which holds the SIMPROF group labels. Rename the dendrogram Samps unconst tree.
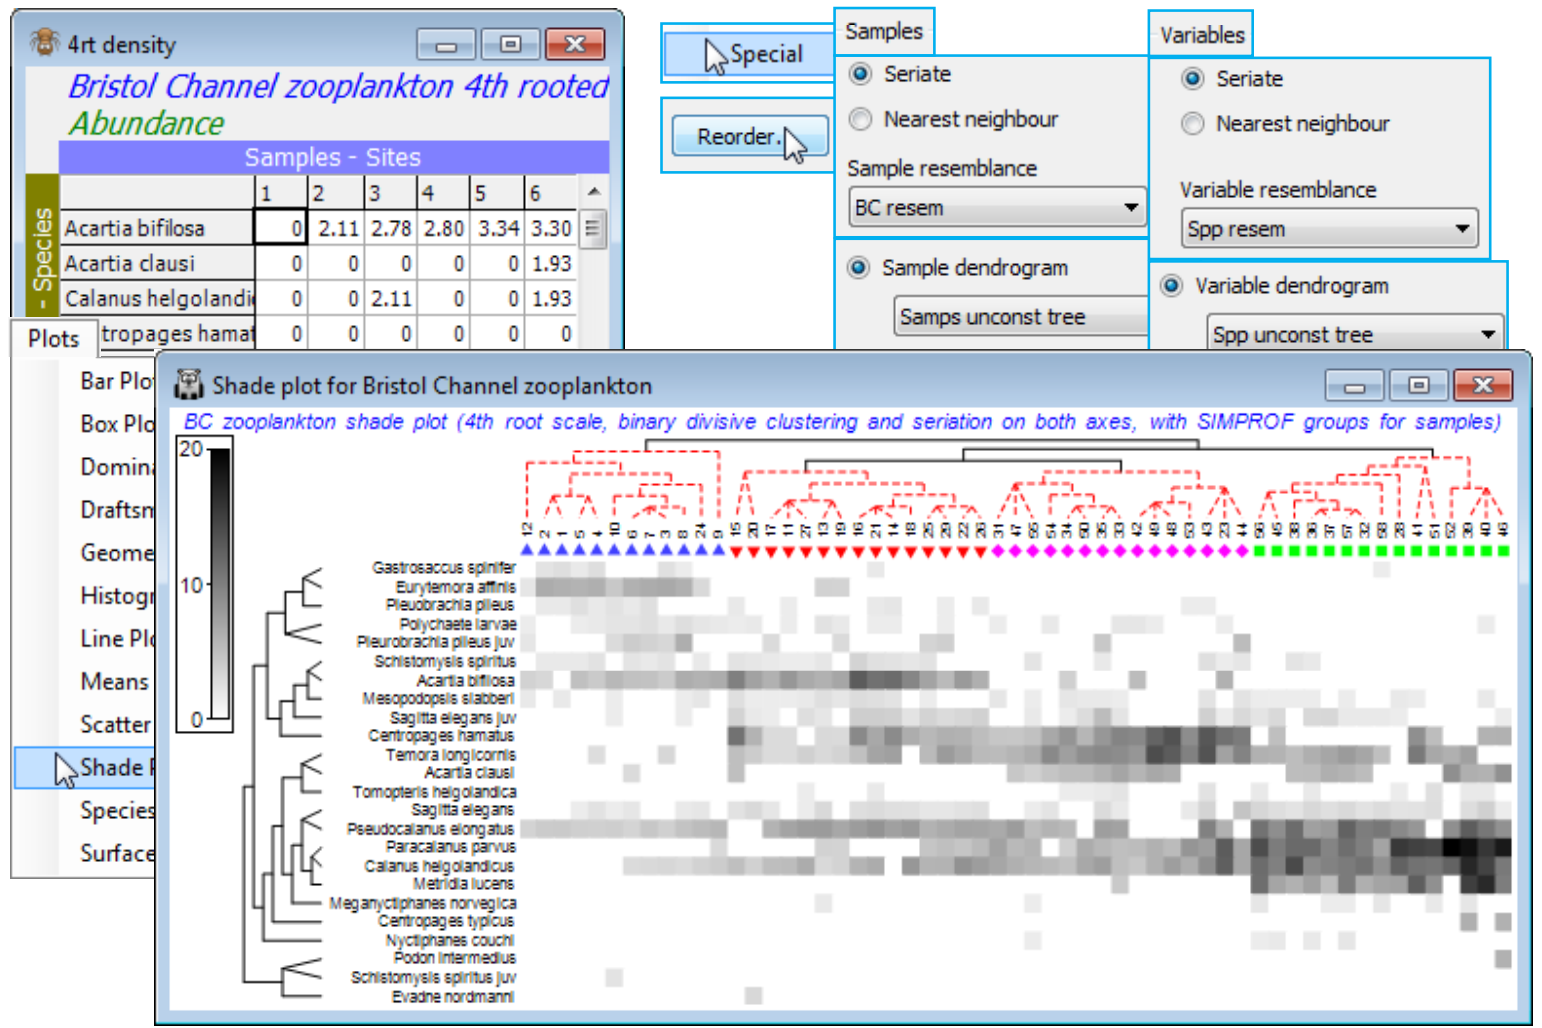
Though it is usually easier to generate an initial shade plot from **Wizards>Matrix display**, it is instructive, for once, to create the components individually and input them to **Plots>Shade Plot**. The data matrix contains only 24 species and there is no real need to reduce it further (though three or four species are infrequently found, in low densities, so could be dropped without affecting the outcome). So, on BC zooplankton density (untransformed) take **Analyse>Resemblance**>(Measure •Index of association) & (Analyse between•Variables). This creates a species similarity matrix Spp resem which is input to **Analyse>CLUSTER>UNCTREE**, much as for the samples above except that the SIMPROF test is turned off this time (we shall see SIMPROF on species shortly), creating Spp unconst tree. With active matrix as the 4th-root transformed version of the plankton densities, 4rt density, run **Plots>Shade Plot** and on this **Graph>Special>Reorder**>Samples>(Order•Seriate >Sample resemblance BC resem) & (Constraint•Sample dendrogram Samps unconst tree) and then Variables>(Order•Seriate>Variable resemblance Spp resem) & (Constraint•Variable dendrogram Spp unconst tree), and (No. of seriate restarts 9999), the latter applying to the Seriate on both axes. Finally, add the sample SIMPROF groups as symbols with **Graph>Sample Labels & Symbols**>Symbols>✓Plot>✓By factor Unctree) and you can remove (uncheck ✓Plot key on Unctree) or amend font sizes on the key from the **Keys** tab (**Keys font** and **Keys title font**). An alternative display would use, for the Samples, (Constraint•Factor groups Unctree) with everything else on the **Reorder** dialog unchanged, and (✓Draw sample constraint group boundaries) would then activate, to draw separating group lines, in place of the sample tree diagram. Other clustering methods such as the constrained binary divisive LINKTREE (Section [13](https://learninghub.primer-e.com/books/primer-v7-user-manual-tutorial/chapter/13-linking-assemblage-to-environment-best-bio-env-linktree)) can also be used, and methods could be mixed on the two axes, if this seems desirable in a particular context. The shade plot here is clearly useful in identifying the key species that typify the four clusters of stations and which discriminate among them. This was used, along with the breakdown of species contributions of (dis)similarities among and within the groups (SIMPER, at the end of this section) to pick out key species for the (strongly serial) *n*MDS bubble plot of Section [8](https://learninghub.primer-e.com/books/primer-v7-user-manual-tutorial/chapter/8-multi-dimensional-scaling-non-metric-nmds-metric-mmds-combined-mds). Save and close Bristol Channel ws for use later.
[](https://learninghub.primer-e.com/uploads/images/gallery/2024-08/screenshotpage190a.png)