# RELATE test on two biotic arrays
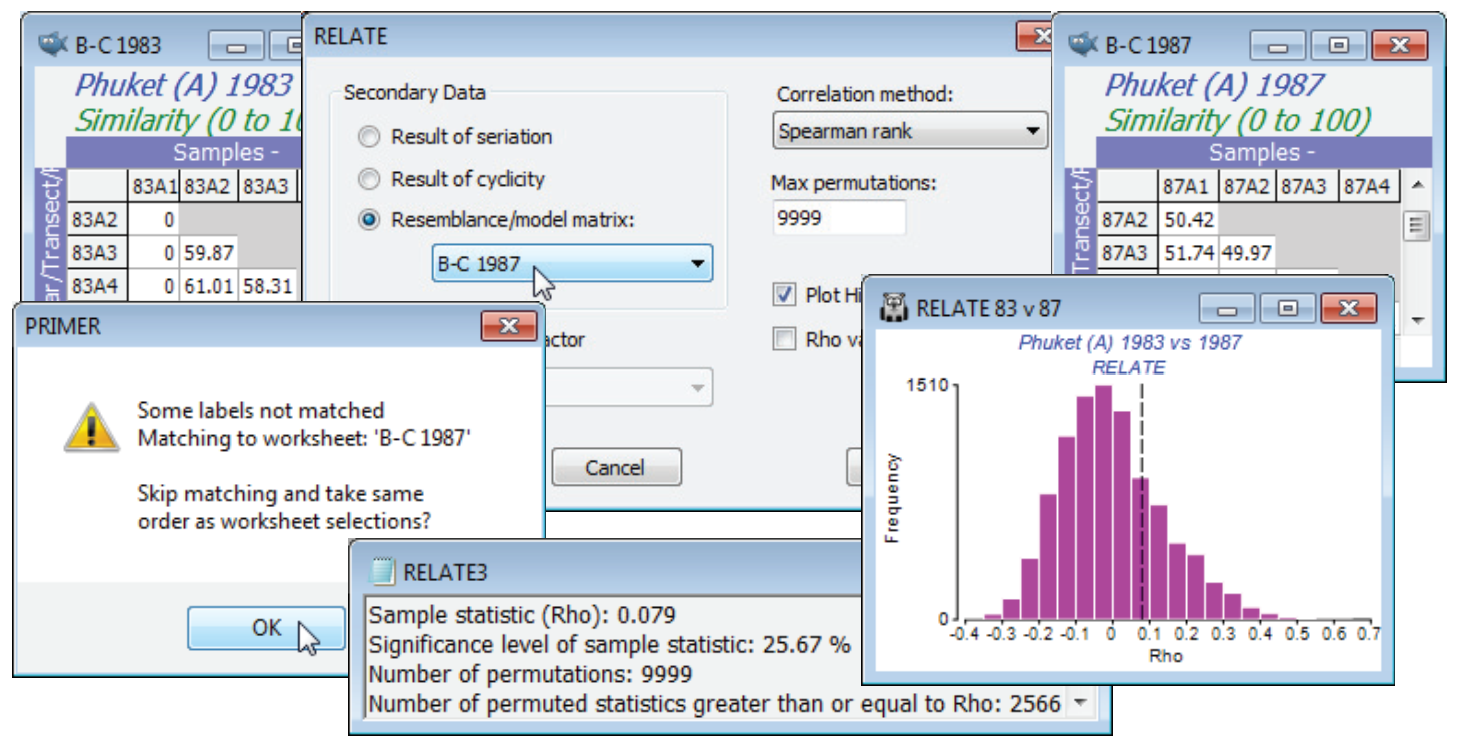
Given the breakdown of the serial gradient structure for 1987, is it now the case that the pattern of change down the transect has nothing at all in common with that for 1983? To answer that question requires a further run of RELATE, but of the two similarity sheets B-C 1983 and B-C 1987 against each other, rather than in comparison with a model matrix. With either as active window, say B-C 1983, take **Analyse>RELATE**>(Secondary Data•Resemblance/model matrix: B-C 1987). There will be a warning message indicating that the sample labels in the two sheets could not be matched. This issue was raised earlier, in Section [11](https://learninghub.primer-e.com/books/primer-v7-user-manual-tutorial/chapter/11-general-data-manipulation-tools-further-pre-treatment). PRIMER typically takes label matching very seriously. When linking separate data sheets, as in **RELATE** or **BEST** (or the ABC plots of Section [16](https://learninghub.primer-e.com/books/primer-v7-user-manual-tutorial/chapter/16-diversity-curves-geometric-class-dominance-and-species-accumulation-plots)), the sample order need not be the same in the two matrices – provided it can find all the sample labels of the active matrix somewhere in the secondary sheet, the correct match will take place. However, it is here inconvenient to have to rename both sets of labels (currently 83A1, 83A2, … and 87A1, 87A2, … ) to a common set (A1, A2, …), especially because the data were extracted from a larger sheet, where PRIMER expects the sample labels to be unique! So, this warning message provides an over-ride (take **OK**) which allows you to skip label matching, and RELATE will pair up the samples in the current order in both sheets. The option will not be offered if the two similarity matrices are not the same size. Instead you will get an error message *No labels matched. Cannot match labels, even relaxed*. The routine will then need to be run again, having selected the same number of samples in each, and it is your responsibility to make sure they are in the same order!
The results do indeed show that the assemblage patterns down the transect in the two years are totally unrelated. The observed match of only $\rho$ = 0.079 is exceeded by about 2500 of the 9999 permutations under the null hypothesis (p<25%) – the null hypothesis (as always) being that there is absolutely no match in spatial pattern ($\rho$ = 0). Omitting the outlier (Position 1) from both series, makes little difference to this conclusion, $\rho$ now dropping still further to 0.016 (p<44%).
[](https://learninghub.primer-e.com/uploads/images/gallery/2024-10/screenshotpage243a.png)