# Rotate axes or rotate/flip data
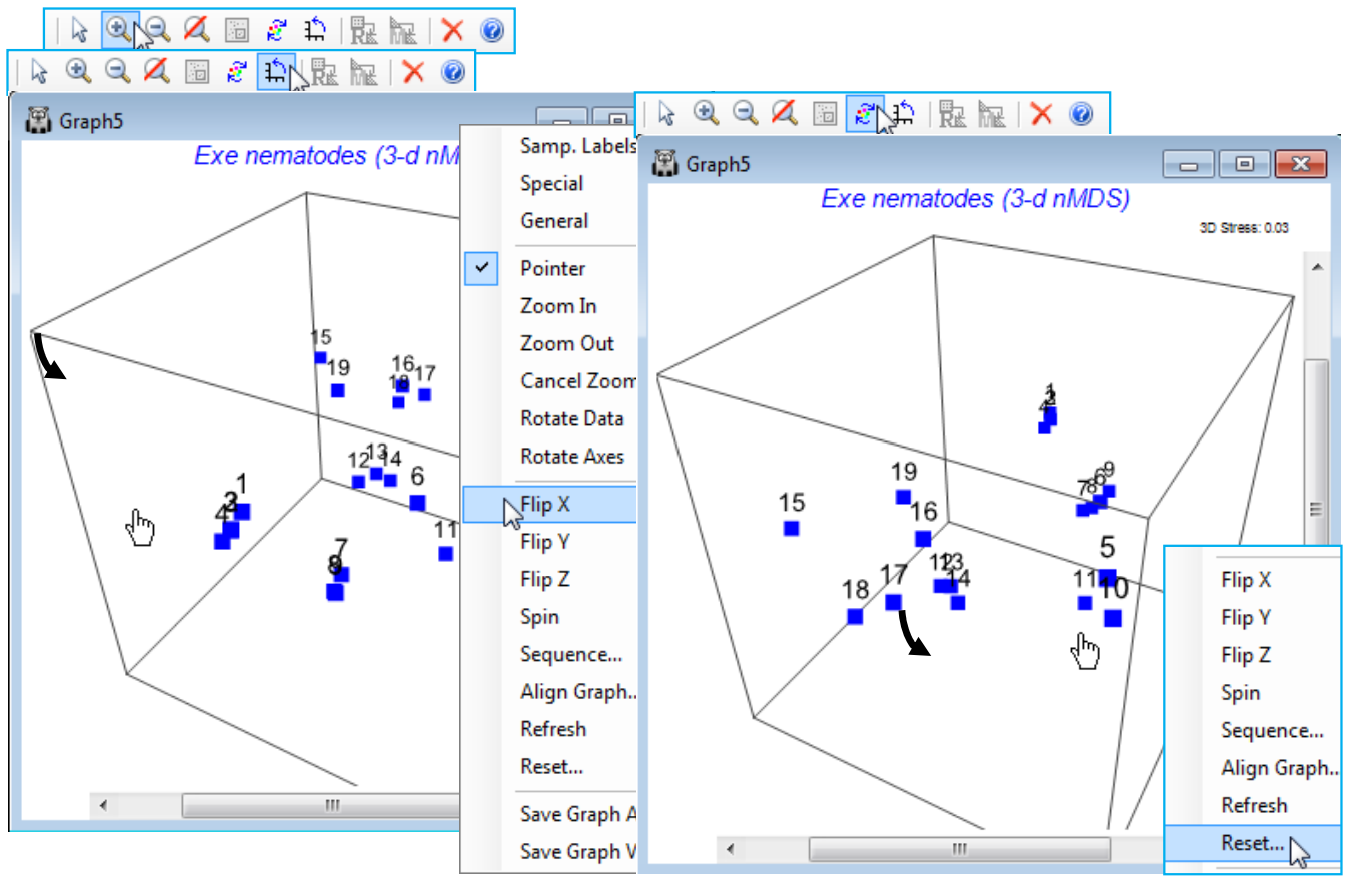
The 3-d Exe nematode *n*MDS plot should be in the current workspace as Graph5 under Multiplot1 (if necessary create it again, with default options, by **Analyse>MDS>Non-metric MDS (nMDS)** on the Bray-Curtis resemblance matrix for a square-root transform of the data in Exe nematode abundance). Uncheck the (Symbols✓By factor) box on the (right-click) **Samp. Labels & Symbols** dialog and again **Zoom In** and take **Rotate Axes**, turning the 3-d box to properly see the position of these points in 3-d space. Note the distinction here between **Rotate Axes** (the [](https://learninghub.primer-e.com/uploads/images/gallery/2024-06/rotateicon.png) icon) and the **Rotate Data** option (the [](https://learninghub.primer-e.com/uploads/images/gallery/2024-07/rotate2icon.png) icon). For a 2-d plot there is no benefit in rotating the axis box to produce a slanting rectangle surrounding the points(!), so this is not implemented. Rotating the points within the rectangular box can occasionally be useful, in order to line them up with a similar ordination for example, and bearing in mind the arbitrary orientation of points – this uses **Rotate Data**. In 3-d, rotating the box is beneficial because it allows a static plot of the points to be viewed dynamically from a range of angles so that the 3-d structure can be properly appreciated – this uses **Rotate Axes** and is available for any 3-d plot. Specifically for 3-d MDS plots, where the relation between the axes of the box and the orientation of points is arbitrary, **Rotate Data** (within a static axis box) is also available, along with reflecting the points in the axes with **Flip X**, **Flip Y**, **Flip Z**. Generally, rotating data will not be as useful as rotating the axes themselves but it can be important where, for example, an MDS plot is being referred to a physical layout of sampling sites in a 3-d medium. Try out the various combinations of rotation/flipping for Graph5, bearing in mind that you can always restore the original relationship of the points to the 3-d box by (right-click) **Reset**.
[](https://learninghub.primer-e.com/uploads/images/gallery/2024-07/screenshotpage125a.png)