# Seriation (Phuket coral transects)
The Phuket coral-reef assemblages at equi-spaced positions down an onshore-offshore gradient (transect A) from Phuket Island, were seen previously in Sections [8](https://learninghub.primer-e.com/books/primer-v7-user-manual-tutorial/chapter/8-multi-dimensional-scaling-non-metric-nmds-metric-mmds-combined-mds), [9](https://learninghub.primer-e.com/books/primer-v7-user-manual-tutorial/chapter/9-analysis-of-similarity-tests-unordered-and-ordered-anosim) and [11](https://learninghub.primer-e.com/books/primer-v7-user-manual-tutorial/chapter/11-general-data-manipulation-tools-further-pre-treatment). Open the workspace Phuket ws, or if not available open just Phuket coral cover 83-87 from C:\Examples v7\Phuket corals, square-root transform, calculate similarity and create *n*MDS plots such as that of Section [8](https://learninghub.primer-e.com/books/primer-v7-user-manual-tutorial/chapter/8-multi-dimensional-scaling-non-metric-nmds-metric-mmds-combined-mds), separately for the two years 1983 and 1987. Do this by selecting the 12 samples along the transect in 1983, with **Select>Samples**>(•Factor levels)>(Factor name: Year>**Levels**>(Include: 83) – note that **Select** works in just the same way on a resemblance matrix as a data sheet – then take **Tools>Duplicate** to make a copy of this smaller resemblance matrix, renaming it B-C 1983. **Analyse>MDS>Non-metric MDS** with default options, except (✓Fix collapse)>(Metric proportion: 0.05). This is needed to avoid the collapse of the *n*MDS plot because of the outlying first point on the transect (as seen in Section [8](https://learninghub.primer-e.com/books/primer-v7-user-manual-tutorial/chapter/8-multi-dimensional-scaling-non-metric-nmds-metric-mmds-combined-mds)). With **Graph>Special>Overlay**>(✓Overlay trajectory)>(Numeric trajectory factor: Position), the serial change in coral community over the transect positions is clear. Repeat these steps for 1987, giving resemblance B-C 1987. The choice of (✓Fix collapse) is not necessary here but if you run the *n*MDS with and without this option you will see that it makes no difference at all to the outcome – the metric proportion of the minimised combined stress function is so small that it cannot influence the plot unless there really is no non-metric information to use, as for Position 1 in 1983, when the metric stress kicks in. (You may want to use the Procrustes routine, **Graph>Align Graph** on one of these plots, specifying the other as the (Configuration Plot: ) to match to – see Section [8](https://learninghub.primer-e.com/books/primer-v7-user-manual-tutorial/chapter/8-multi-dimensional-scaling-non-metric-nmds-metric-mmds-combined-mds)) Align graphs automatically – to see they are indeed identical).
[](https://learninghub.primer-e.com/uploads/images/gallery/2024-10/screenshotpage242a.png)
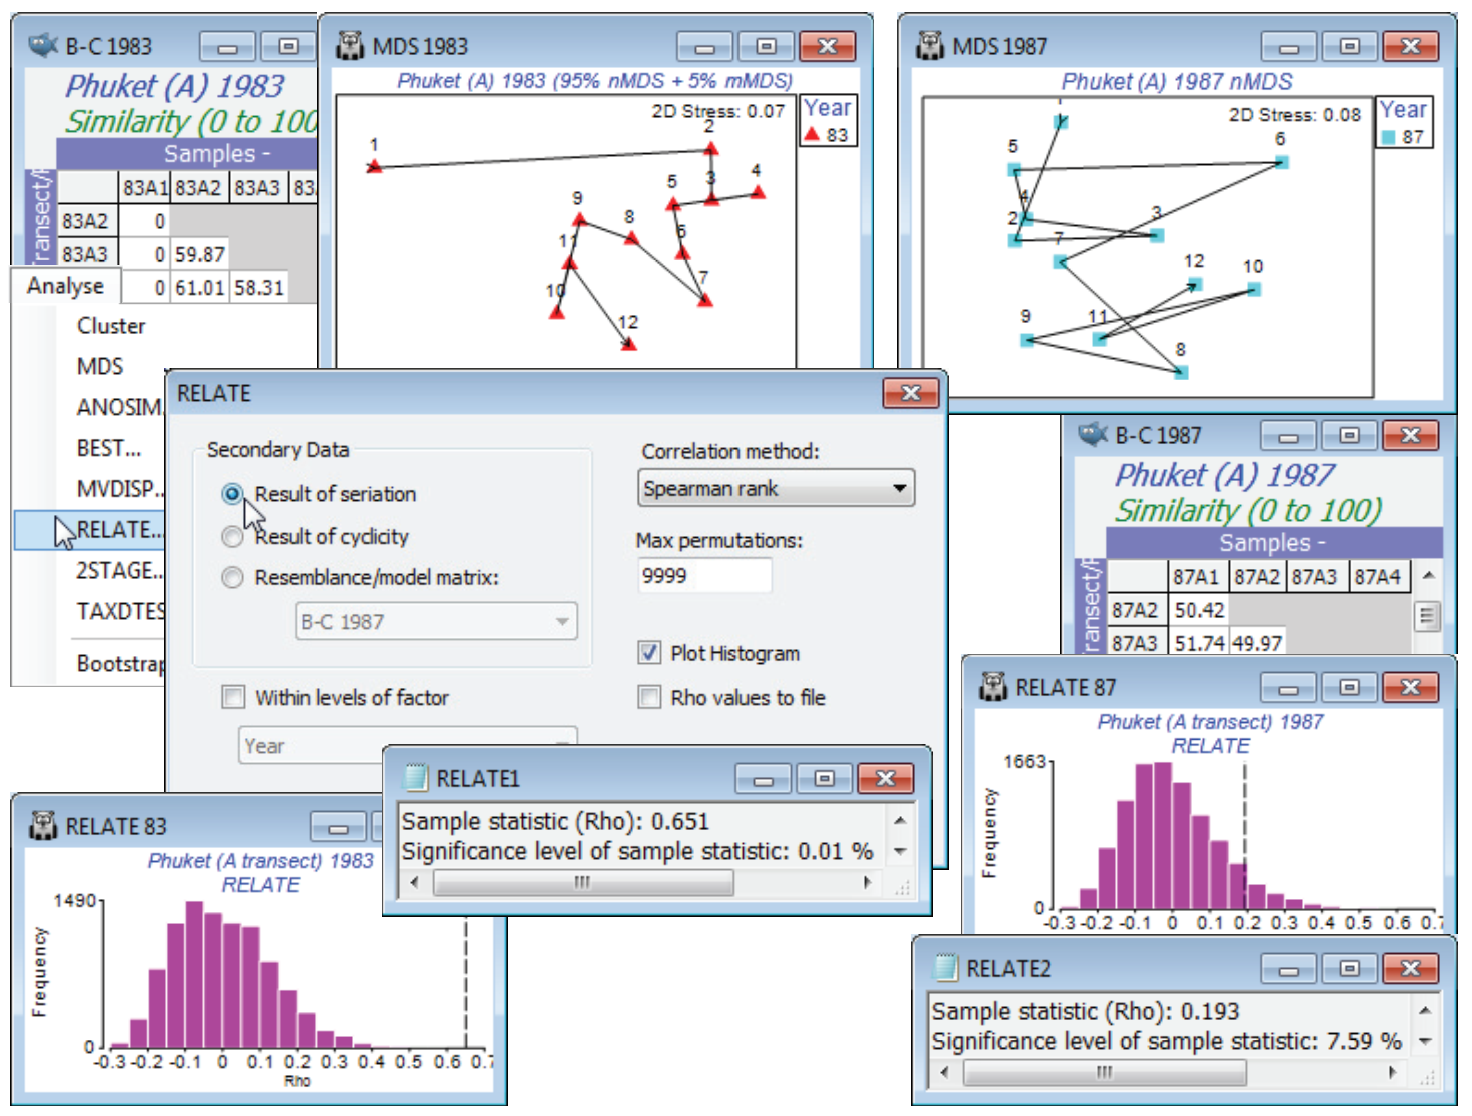
The serial change along the transect in 1983 has largely disappeared in 1987, with sedimentation impact from nearby dredging for a deep-water port. This is reflected in the RELATE tests shown above, with $\rho$ declining from 0.651 to 0.193, e.g. on B-C 1983, **Analyse>RELATE**>(Secondary Data•Result of seriation) & (Max permutations: 9999), with defaults for the other choices, gives a histogram and results window with observed $\rho$ = 0.651 greater than for any of the 9999 simulated values, so the null hypothesis of no seriation at all ($\rho \approx$ 0) is decisively rejected, p<0.01%. Note that the strong outlier has not wrecked this test, though it somewhat degrades the match to a model of equi-stepped change, as is seen by $\rho$ rising to 0.75 if this first transect position is omitted. \[Since we have not provided the factor Position when using the (•Result of seriation) option, the routine has to assume that samples are in the desired equi-stepped serial order – a different order, or a wish to fit unequal steps, perhaps by omission of an intermediate transect sample, must be handled by a Model Matrix.\] The $\rho$ = 0.193 for 1987 is more in the body of the null distribution however, and there is no clear evidence in the RELATE test for any serial structure (p $\approx$ 7.5%). In this simple case, there is a very close link with the ordered, unreplicated 1-way ANOSIM test on factor Position (see Section [9](https://learninghub.primer-e.com/books/primer-v7-user-manual-tutorial/chapter/9-analysis-of-similarity-tests-unordered-and-ordered-anosim)), with R (not $\rho$) statistics of R$^{\text Os}$ = 0.655 (p<0.01%) and 0.194 (p $\approx$ 7.0%) for 1983 and 87.