# Seriation with replication
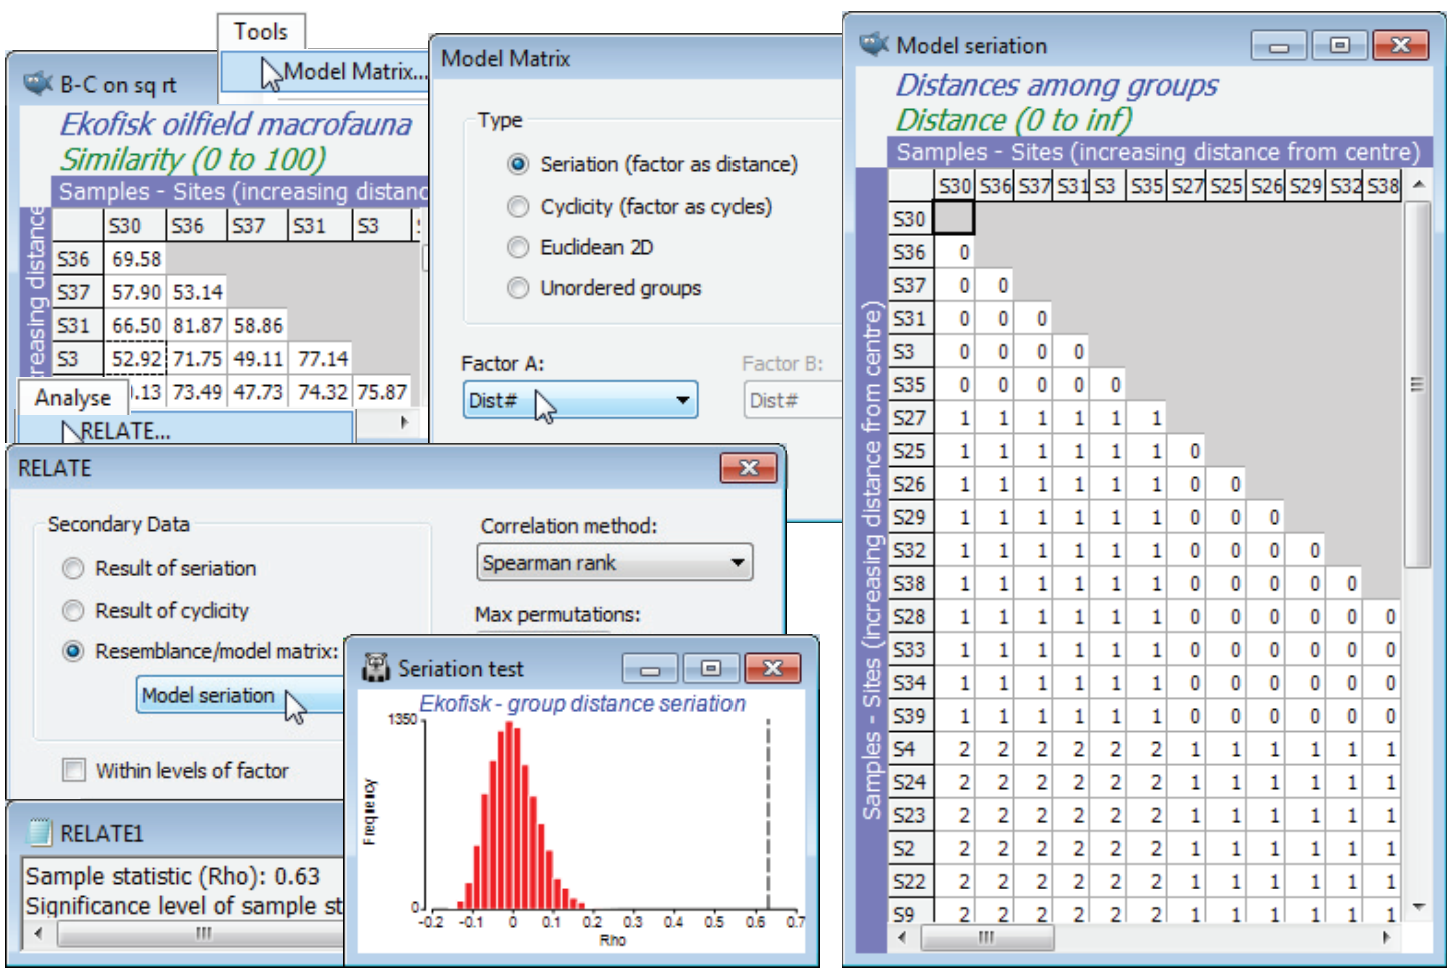
Return to the macrofaunal data set from the Ekofisk oilfield, with workspace Ekofisk ws last saved in C:\ Examples v7\Ekofisk macrofauna in Section [9](https://learninghub.primer-e.com/books/primer-v7-user-manual-tutorial/chapter/9-analysis-of-similarity-tests-unordered-and-ordered-anosim), following an ordered 1-way ANOSIM test (with replication) on the similarity matrix B-C on sq rt from data Ekofisk macrofauna counts. This used factor Dist#, which is the numeric form of the four groups of sites at different distances from the oilfield, $\sim$logarithmically spaced (1$\equiv$D:<250m; 2$\equiv$C: 250m-1km; 3$\equiv$B: 1-3.5km; 4$\equiv$A:>3.5km). The rationale for an ordered test here was discussed in Section [9](https://learninghub.primer-e.com/books/primer-v7-user-manual-tutorial/chapter/9-analysis-of-similarity-tests-unordered-and-ordered-anosim) (and Somerfield PJ, Clarke KR, Olsgard F 2002, *J Anim Ecol* 71:581-593), namely the improved power but more limited generality in testing the null *H$_0$: no differences* against an ordered alternative *H$_1$: A$\rightarrow$B$\rightarrow$C$\rightarrow$D*, rather than the unordered alternative *H$_1$: A, B, C, D differ* (in ways unspecified). Those authors, and previous versions of PRIMER, did not use the generalised (ordered) ANOSIM statistic – which is new to PRIMER 7 – but used the analogous RELATE statistic $\rho$ between the biotic resemblances and a model matrix for *seriation with replication*. This is a model matrix which **Analyse>RELATE** does not handle internally in the (•Result of seriation) option – that is restricted to simple seriation with no replication – but which can be simply constructed from the active matrix B-C on sq rt, using **Tools>Model Matrix**>(Type•Seriation (factor as distance)) & (Factor A: Dist#). \[The factor Dist, splitting the sites into alphabetic levels D, C, B, A, will not work here because distances cannot be calculated between names\]. A model matrix is generated – rename this Model seriation – having blocks of 0’s down the diagonal (sites within a distance group are considered 0 distance apart), then off-diagonal blocks of 1’s then 2’s then 3’s (sites in groups 1 and 2 are 1 unit apart, in groups 1 and 3 are 2 units apart etc.). Again with B-C on sq rt active, run **Analyse>RELATE**>(Secondary data• Resemblance/model matrix: Model seriation), giving $\rho$ = 0.63 (p<0.01%), providing clear evidence of group differences, with large $\rho$ confirming the strongly ordered gradient away from the oilfield.
[](https://learninghub.primer-e.com/uploads/images/gallery/2024-10/screenshotpage245a.png)