# SIMPER on 2-way crossed layout (Tasmania nematodes)
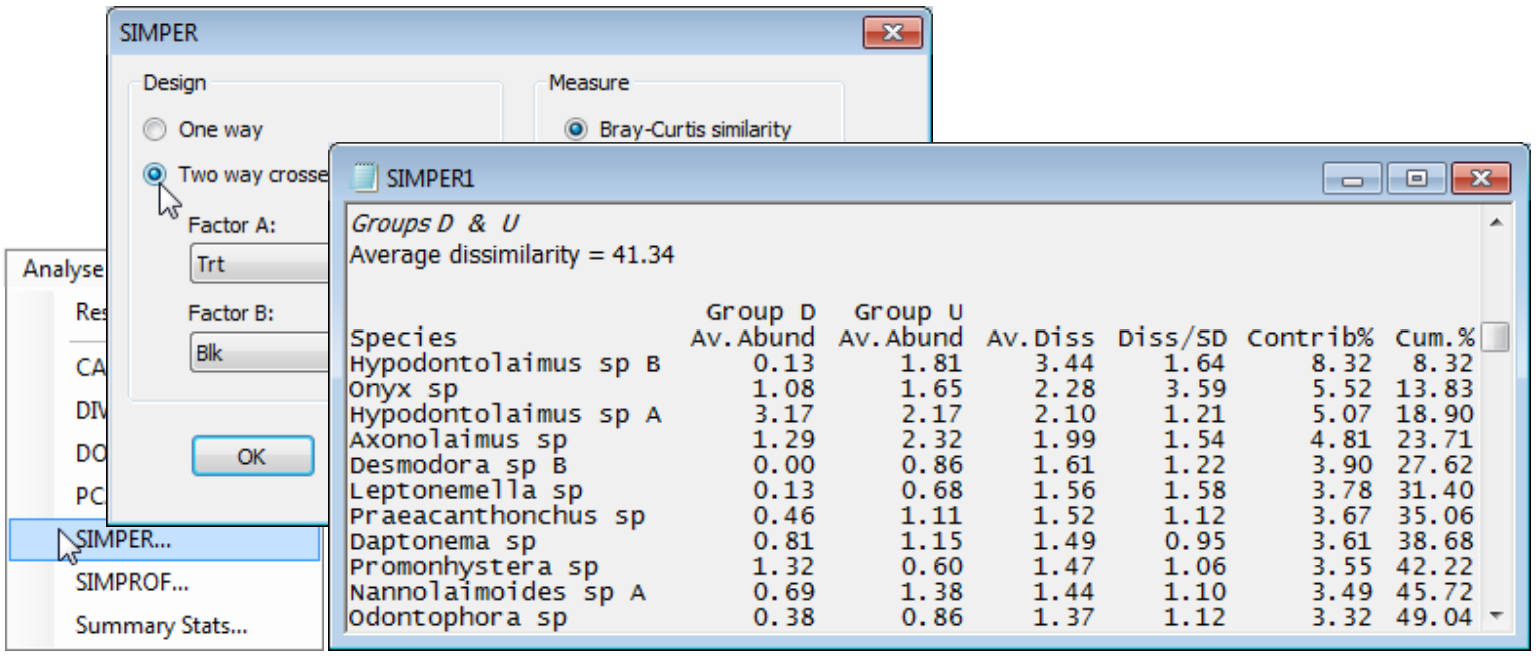
A natural extension to the 1-way SIMPER is to the 2-way crossed design, so re-open the Tasmania ws workspace of meiofaunal communities Tasmania nematodes on a sand-flat, with disturbed and undisturbed patches (factor ‘treatment’ *Trt*: D or U) at 4 locations (factor ‘block’ *Blk*: 1 to 4) in C:\ Examples v7\Tasmania meiofauna, last seen under 2-way crossed ANOSIM in Section [9](https://learninghub.primer-e.com/books/primer-v7-user-manual-tutorial/chapter/9-analysis-of-similarity-tests-unordered-and-ordered-anosim). ANOSIM showed there was a clear community difference associated with the natural disturbance by soldier crab activity (not caused by it, necessarily), removing the equally large block differences. In similar fashion, a 2-way SIMPER for treatment differences will remove block differences by looking only at dissimilarities between treatments within blocks and breaking the average of these down into the contributions from species. Starting from the 4th-root transformed nematode sheet gives output:
[](https://learninghub.primer-e.com/uploads/images/gallery/2024-08/screenshotpage201b.png)
Of course SIMPER must operate with the active sheet as the data matrix rather than from the Bray-Curtis resemblances since it needs to recalculate all the individual species terms that make up the final dissimilarities. The average dissimilarity between disturbed and undisturbed samples (from the same blocks) is not large, at 41.3, but compares with average similarities within the *D* and *U* groups (only for pairs of samples within each block, thus removing the block effects again) of 68.6 and 73.2 – the header lines of the first two tables of the output – i.e. dissimilarities of 31.4 and 26.8. The *D vs. U* difference is seen to be a sum of small contributions from a rather large set of species. (*Hypodontolaimus sp B* heads the list but this is not because it is the most abundant species overall, e.g. *Hypodontolaimus sp A* has larger densities). In fact, it is unlikely that one or two species will dominate the contribution because of the severity of a fourth root transformation – the heavier the transform, the more species will be involved in the similarity calculation and thus the breakdowns. The symmetry of a 2-way crossed design dictates that the decomposition can be done on the second factor, removing the first, and these tables are also provided, though of less interest in this context.