# SIMPER on (squared) Euclidean (N Sea biomarkers)
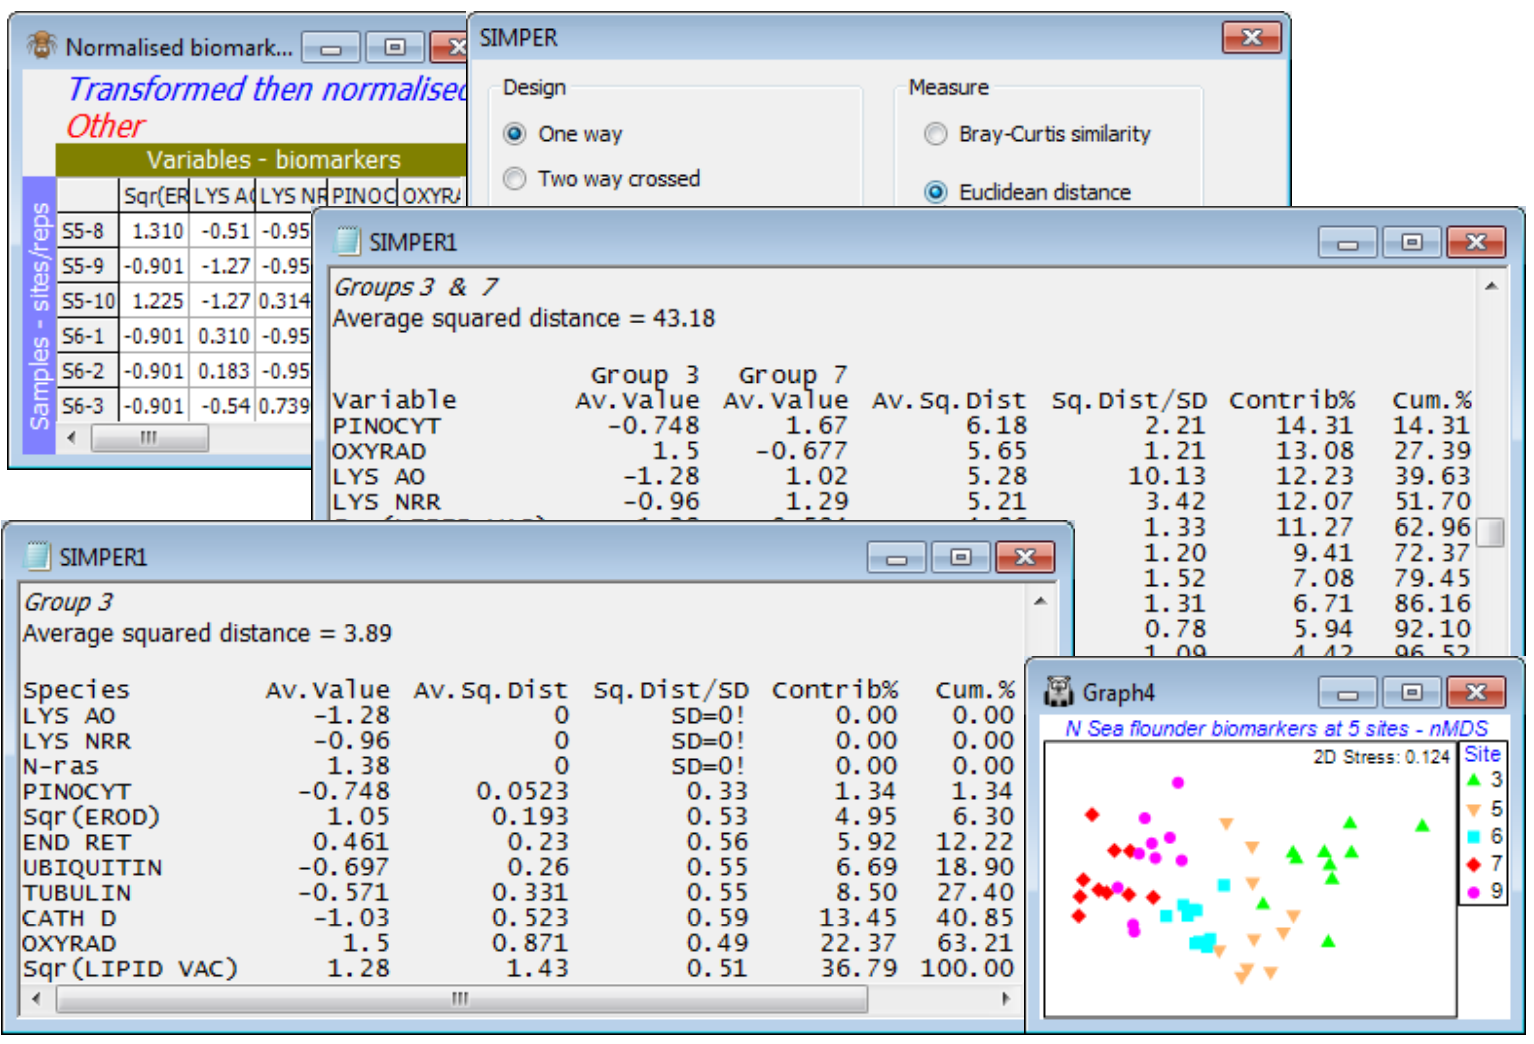
Save and close Tasmania ws and, as a last example, open the recently closed N Sea ws workspace. On the Normalised biomarkers sheet, run **Analyse>SIMPER**>(Design•One way>Factor A: Site) & (Measure•Euclidean distance), unchecking the box which truncates the listings. The contaminant gradient tends to decline from site *3* (mouth of the Elbe) to *7* and increase on the Dogger Bank (*9*), and the table comparing sites *3* and *7* gives the highest average Euclidean distance squared from all 11 biomarkers – these are also the two endpoint sites of the gradient seen on the biomarker *n*MDS plot of Section [9](https://learninghub.primer-e.com/books/primer-v7-user-manual-tutorial/chapter/9-analysis-of-similarity-tests-unordered-and-ordered-anosim) (and ANOSIM R = 0.99 for *3 vs 7*). The normalisation puts all biomarkers on an equi-variable scale so all are likely to contribute something, but *Pinocytosis*, *Oxyradicals* and the two *Lysosomal stability* indices head the list of discriminating variables for these sites (evident also from the *coherent variables* line-plots recently seen). \[The SIMPER breakdown is defined naturally in terms of squared Euclidean distance, not Euclidean itself – eqtn (2.13) of CiMC – but this is not important to PRIMER because ANOSIM tests, *n*MDS etc. all work on ranks of these distances and those are identical between Euclidean and Euclidean squared\]. The starting tables in the output that give breakdown of distances within groups are somewhat less natural than they are for Bray-Curtis, (for which both similarity and dissimilarity can be written as a natural sum over species – see eqtns (7.2) and (7.3), CiMC). They are again read from the top downwards, starting with variables which contribute least to the average Euclidean distance (squared) within a group – the key information to scan being column 2. For site 3, having a low average within-group distance (squared) of 3.9 (c.f. 43.2 between sites 3 and 7), the lysosomal stability and *Pinocytosis* are zero, and *N-ras* and *EROD* consistently high for nearly all samples (an indication of impact); these indices fill the top 5 places.
[](https://learninghub.primer-e.com/uploads/images/gallery/2024-08/screenshotpage202a.png)