# Special menu for slicing & orientation of dendrograms
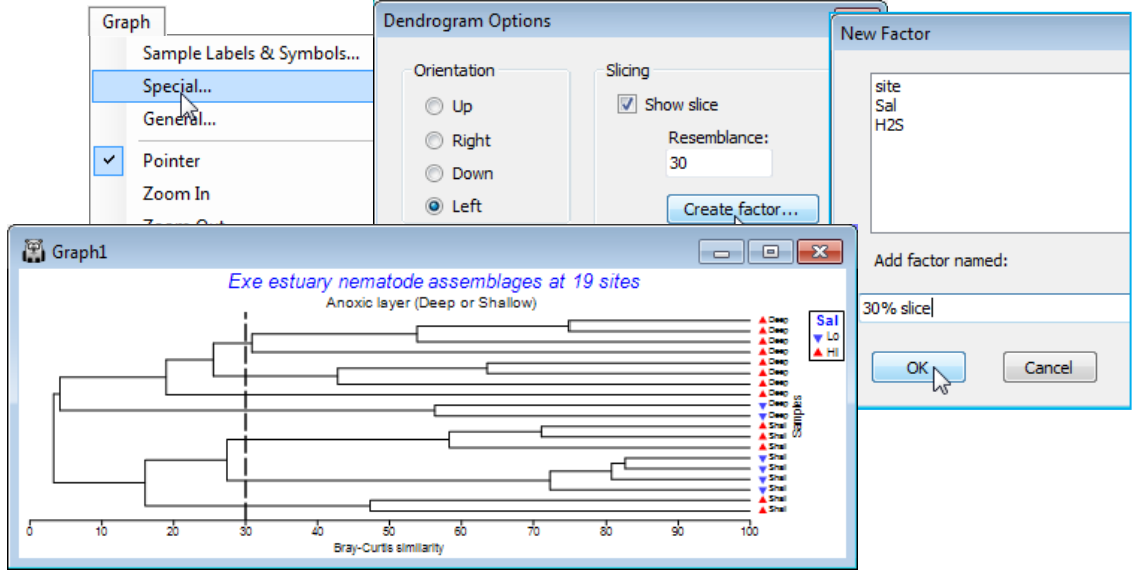
Unlike **Graph>Samples Labels & Symbols** or **Graph>General**, which take you to the Graph Options dialog box, which is displayed in consistent format for these and other appropriate tabs (Titles, X axis, Y axis, Keys), the **Graph>Special** menu item takes you to a specific dialog box applicable only to that type of plot – here a Dendrogram options dialog. This allows selection of orientation, e.g. **Graph>Special**>(Orientation•Left), and a slice drawn through the diagram at a specified resemblance, e.g. by Slicing:(✓Show slice)>(Resemblance:30) & (**Create factor**>Add factor named:30% slice). This creates a factor, levels (a, b, c, ..), of the groups given by that slice.
[](https://learninghub.primer-e.com/uploads/images/gallery/2024-06/screenshotpage87b.png)
The newly created factor resulting from the plot will again be back-propagated to any previous data sheet on its direct branch, so whilst it could be utilised to accentuate the clustering structure in this dendrogram, by applying it as the symbols, a more profitable use might be for symbol display on an MDS plot (Section [8](https://learninghub.primer-e.com/books/primer-v7-user-manual-tutorial/chapter/8-multi-dimensional-scaling-non-metric-nmds-metric-mmds-combined-mds)), to judge the extent of agreement between clustering and ordination of the same data, under the same resemblance measure. Save the workspace as Exe ws, and close it.