# Surface plots
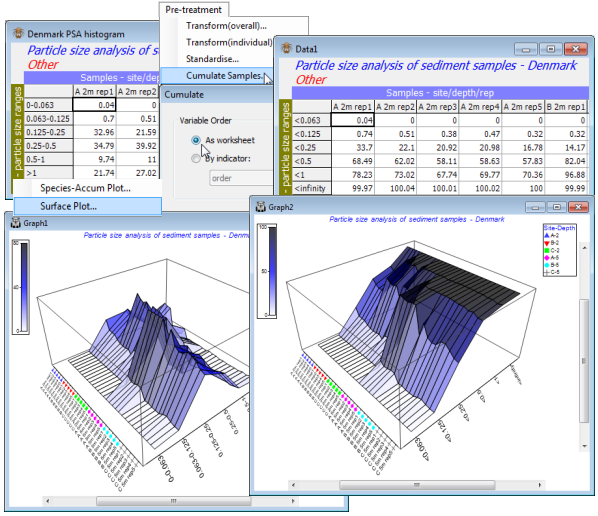
The smoothing effect can best be seen by **Plots>Surface Plot** of both Data1 and Data2 sheets – a further graph type new to PRIMER 7, but which should be reserved only for cases such as this, where there is genuine ordering of the variables. Symbols can be added to the sample axis with **Graph>Sample Labels & Symbols**, and colour shading introduced (as it could have been with the above Shade Plots) by **Graph>Special>Key**. Save the workspace as Denmark ws for use later.
[](https://learninghub.primer-e.com/uploads/images/gallery/2024-05/screenshotpage64a.png)