Taxonomic distinctness (European groundfish)
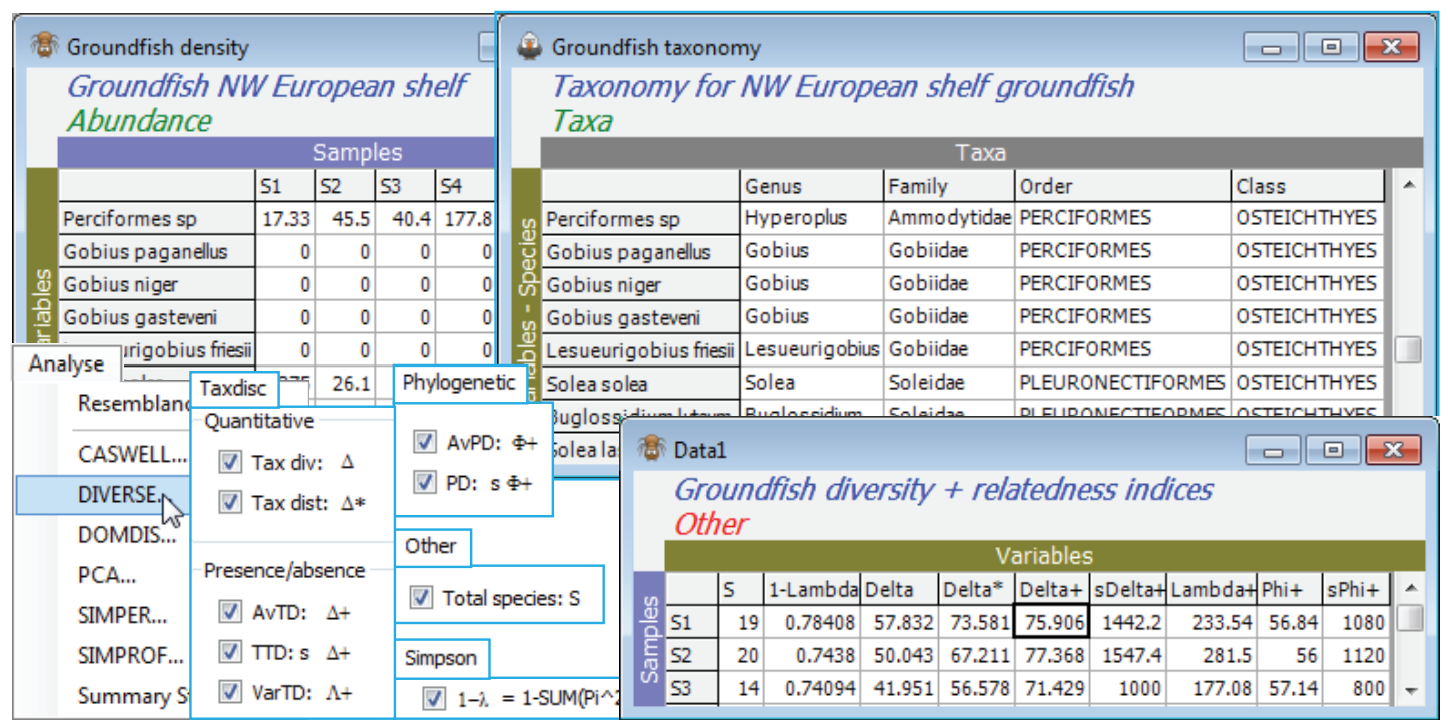
The aggregation matrix for the NW European beam-trawl survey data on groundfish assemblages (93 species in 277 samples, from 9 sea areas) was last seen in Section 11, where it was checked for consistency. However, the workspace is now rather cluttered so open a new one in C:\Examples v7 \Europe groundfish, containing data Groundfish density and Groundfish taxonomy, and save it as Groundfish ws2. Here, data and aggregation matrices have the same full set of species, in the same order. With Groundfish density as active sheet, run Analyse>DIVERSE and on the Taxdisc and Phylogenetic tabs, check (✓) all the quantitative and presence/absence options: $\Delta$ (= delta), $\Delta^\ast$, $\Delta^{\scriptscriptstyle +}$, $S \Delta^{\scriptscriptstyle +}$, $\Lambda^{\scriptscriptstyle +}$ (= lambda+), $\Phi^{\scriptscriptstyle +}$ (= phi+) and $S \Phi^{\scriptscriptstyle +}$, taking also (✓Results to worksheet). Under Taxonomy>(Type•Taxonomy) take all the defaults: (Variable info. worksheet: Groundfish taxonomy) & (Current level of sample data: Species) & (Use links>(From level: Species) & (To level: Class)) & (Weights•User specified), with the Weights left on their values of step lengths of 1 between all levels. Take also the number of species ($S$) and Simpson evenness $1-\lambda$, from the Other tab. Look at the correlation between these indices by Plots>Draftsman Plot. (To obtain the plot overleaf, the axis scales have been switched off by unchecking (✓Show scales) from Graph>Special).
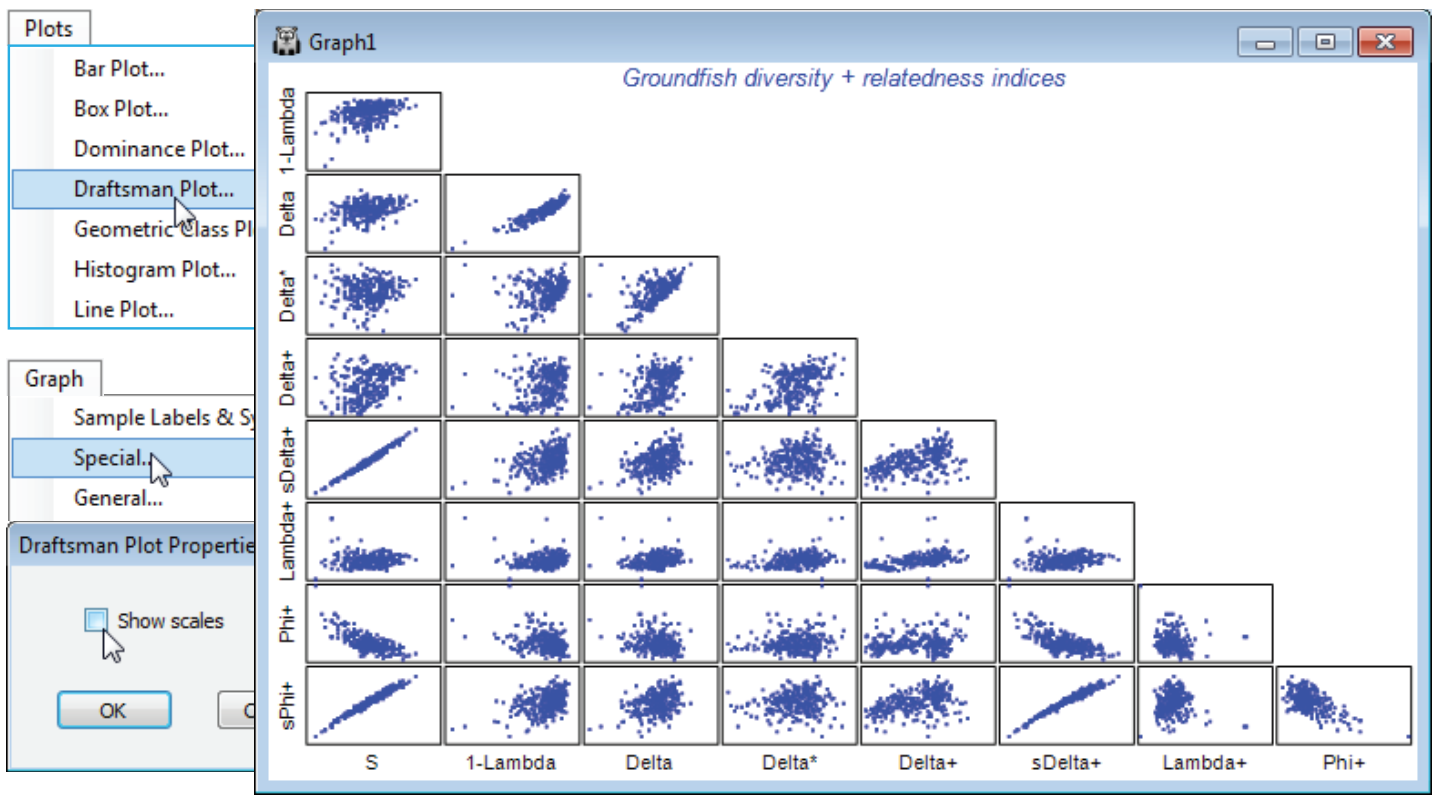
In the draftsman plot, note particularly the first column of plots, which set each index against the number of species, $S$. These bear out the general observations of Clarke KR & Warwick RM 2001, Mar Ecol Prog Ser 216: 265-278, and Chapter 17 of the CiMC manual, that:
- a) total phylogenetic diversity PD ($S \Phi^{\scriptscriptstyle +}$) and total taxonomic distinctness TTD ($S \Delta^{\scriptscriptstyle +}$) are dominated by $S$ (which will be strongly influenced by the differing sampling effort for the 277 rectangles);
- b) an attempt to correct for this by using average PD ($\Phi^{\scriptscriptstyle +}$) is unsuccessful, there still being a strong correlation with $S$ (negative now), but it is successful for average taxonomic distinctness AvTD ($\Delta^{\scriptscriptstyle +}$) and variation in taxonomic distinctness VarTD ($\Lambda^{\scriptscriptstyle +}$), Clarke & Warwick 2001 showing that (mechanistic) independence of $\Delta^{\scriptscriptstyle +}$ and $\Lambda^{\scriptscriptstyle +}$ from $S$ is to be expected on theoretical grounds;
- c) quantitative taxonomic diversity ($\Delta$) retains a strong element of the evenness component from the species abundance distribution, i.e. is strongly correlated with Simpson’s 1–$\lambda$. In fact, $\Delta$ is a compounding of Simpson’s $1-\lambda$ and a pure relatedness index, thus quantitative taxonomic distinctness $\Delta^\ast = \Delta/(1–\lambda$) more nearly represents pure relatedness, and is seen to be much less positively correlated with evenness (here as Simpson $1-\lambda$ but the same is true for Pielou’s $J^\prime$, or even Shannon $H^\prime$ – which is largely an evenness measure, with a small component of $S$);
- d) the quantitative ($\Delta^\ast$) and pres/abs ($\Delta^{\scriptscriptstyle +}$) forms of AvTD, though positively correlated ($\approx 0.5$), are not highly so, suggesting (as other evidence does) that they capture somewhat different aspects of relatedness and are both worth examining when quantitative data exists;
- e) because of their use of the taxonomic tree structure, the taxonomic distinctness measures capture an axis of variation in the samples not reflected by the standard diversity measures (this can be seen by repeating the PCA, and the MDS variables ordination, near the start of this section, for the above relatedness indices together with the classic measures $S$, $d$, $J^\prime$, $H$, $\alpha$, $H^\prime$ and $1-\lambda^\prime$).