# (Tees Bay macrofauna time series)
A clearer, static, example of the benefits of split trajectories on ordination plots is provided by macrofauna data from Tees Bay, collected and analysed by the Brixham Laboratory, SW England, in (amongst other locations) four sub-tidal areas, 1 to 4, spanning approximately 10km of the N Sea coast of the UK, with two sites (a/b, c/d, …) in each area, and these data result from pooled grab samples at each site. The samples in this case were collected in September, annually from 1973 to 1996 (Warwick *et al*, 2002, *Mar Ecol Prog Ser* 234: 1-13).
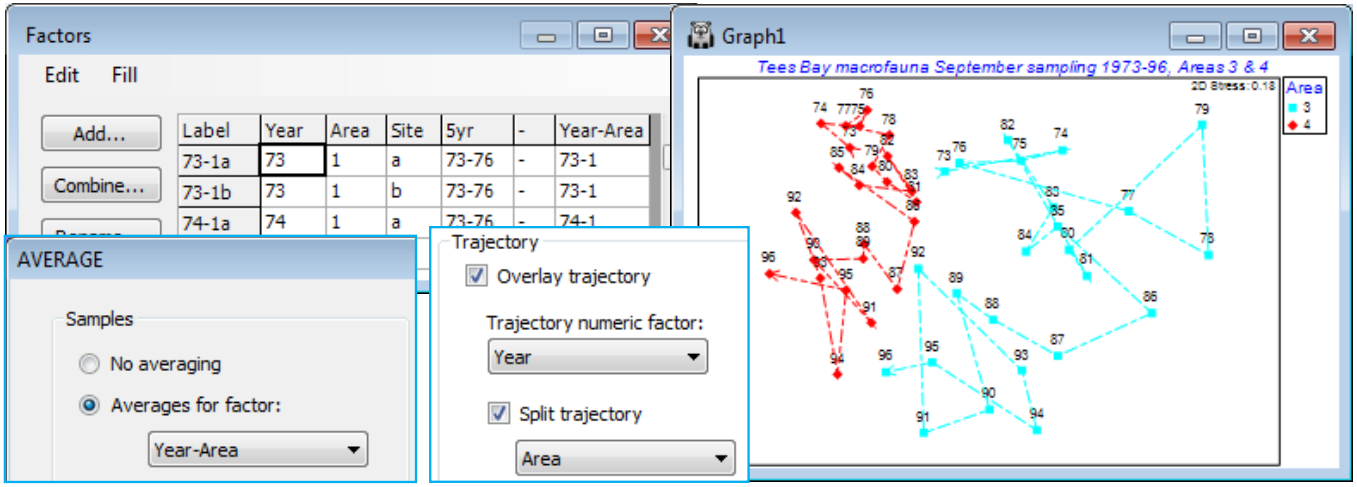
Open Tees macrobenthic abundance.pri in C:\Examples v7\Tees macrobenthos, and the factors by **Edit>Factors**, and create a combined *Year-Area* factor. (Do this by **Add**>(Add factor named: -), put a hyphen in the first cell, highlight the column by clicking on the factor label -, and **Fill>Value**, then take **Combine** and move Year, - and Area names to the Include box; this construction of a combined factor was illustrated in Section [2](https://learninghub.primer-e.com/books/primer-v7-user-manual-tutorial/chapter/2-factors-and-indicators-identifying-sample-and-species-groups)). Now fourth-root transform the data, average over the sites with **Tools>Average**>(Averages for factor: Year-Area) and compute Bray-Curtis similarities. Select two areas – one within the immediate environment of the Tees estuary (area 2 or 3) and one outside (1 or 4), see Fig.6.17 of CiMC. For example, **Select>Samples**>(•Factor levels)>(Factor name: Area)>Levels>(Include: 3, 4). Now run *n*MDS and on **Samp. Labels & Symbols** set labels as Year and symbols as Area.
Finally, on **Special>Overlays** add trajectories of Year, split by Area. Save the workspace as Tees ws – it is needed for hypothesis tests in Section [9](https://learninghub.primer-e.com/books/primer-v7-user-manual-tutorial/chapter/9-analysis-of-similarity-tests-unordered-and-ordered-anosim) – and close it.
[](https://learninghub.primer-e.com/uploads/images/gallery/2024-07/screenshotpage131b.png)