# (Tikus Is coral cover)
The Tikus Island, Indonesia, data on % area cover of coral communities on 10 transects in the years 1981, 83, 84, 85, 87 and 88, were first met in Section [5](https://learninghub.primer-e.com/books/primer-v7-user-manual-tutorial/chapter/5-resemblance-similarities-dissimilarities-and-distances), with data sheet Tikus coral cover in the directory C:\Examples v7\Tikus corals. It is discussed extensively in the context of resemblance choice for multivariate analysis in Chapter 16 of CiMC but here, as an illustration of *k*-dominance curve testing, we will use only the differences between two of the years: 1981 and 1983, before and after the major El Niño event of 1982/3.
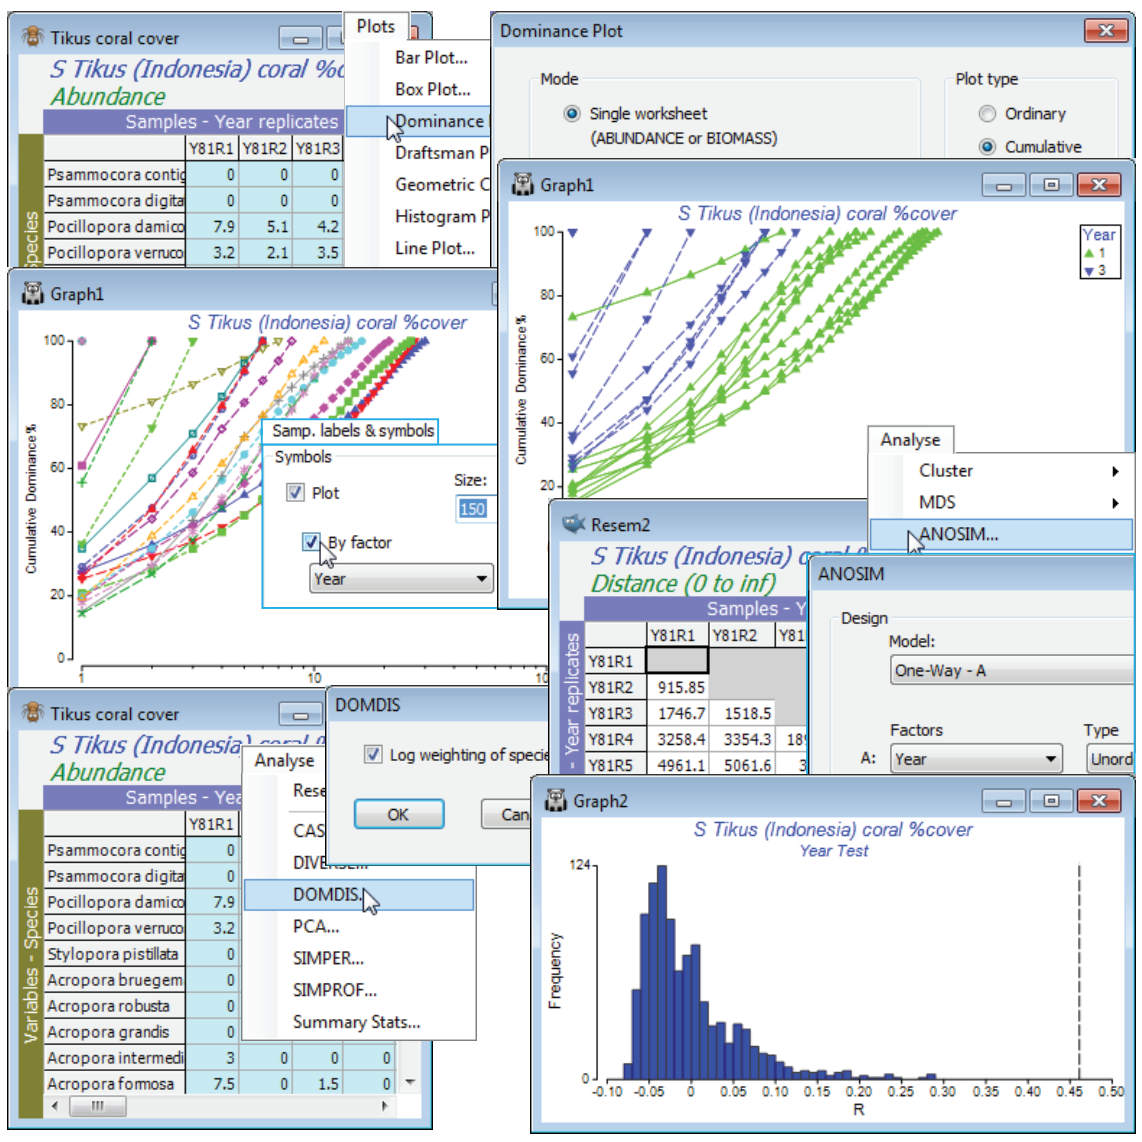
Open Tikus coral cover in a new workspace and **Select>Samples**>(•Factor levels)>(Factor name: Year)>**Levels** and Include only 1 and 3. **Plots>Dominance Plot**, with the defaults of (Mode•Single worksheet) and (Plot type•Cumulative), will generate the *k*-dominance curves for all the selected samples on a single plot. Show the group structure of 10 replicates from each of two years by **Graph>Sample Labels & Symbols**, switching on (Symbols:✓Plot>✓By factor: Year). To test for significance of the (rather obvious!) differences between the curves in the two years, run **Analyse>DOMDIS**>(✓Log weighting of species ranks) on Tikus coral cover. This generates a resemblance matrix Resem1, giving the distance between all pairs of curves, which is then input to **Analyse>ANOSIM**>(Model: One way - A)>(Factors A: Year)>(Type: Unordered), with the other defaults taken. The *R* statistic is 0.46, easily larger than for any of the 999 random permutations under the hypothesis of no year difference, thus p<0.1% (and the null histogram shows it would be a great deal smaller, for more simulations), signifying a clear change in dominance pattern between the years. The *R* value is depressed somewhat by one outlying replicate in 1981 which is much more dominated, and less species rich, than the other 9 transects, but there is no justification for leaving it out of the analysis. Close the workspace – it will not be needed again.
[](https://learninghub.primer-e.com/uploads/images/gallery/2024-11/screenshotpage284a.png)