# Tools menu - other items; Tools Options menu
**Tools** operations on resemblances which are discussed elsewhere are: a) **Dissim** and **Unravel** in Sections [5](https://learninghub.primer-e.com/books/primer-v7-user-manual-tutorial/chapter/5-resemblance-similarities-dissimilarities-and-distances) & [6](https://learninghub.primer-e.com/books/primer-v7-user-manual-tutorial/chapter/6-clustering-methods-cluster-simprof-unctree-krcluster) – the former turns similarity into dissimilarity, or *vice-versa*, and the latter creates a single column of entries from unravelling rows of the triangular matrix; b) **Model Matrix** and **Expand** in Section [14](https://learninghub.primer-e.com/books/primer-v7-user-manual-tutorial/chapter/14-further-matching-of-multivariate-patterns-relate-2stage-best-mvdisp) – these are less trivial and need contextual explanation; and c) **Stop Tasks** in Section [6](https://learninghub.primer-e.com/books/primer-v7-user-manual-tutorial/chapter/6-clustering-methods-cluster-simprof-unctree-krcluster) (self-explanatory). That leaves only **Tools>Options**, PRIMER’s default settings.
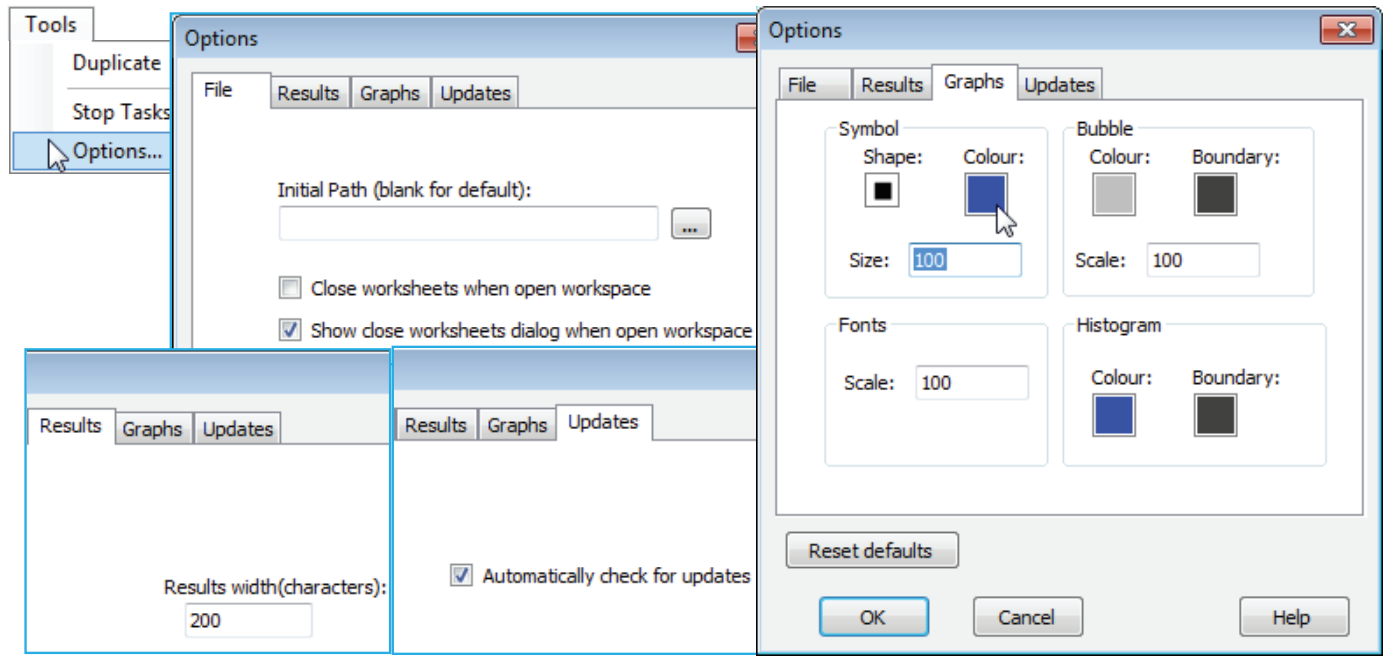
**Options** appears on the **Tools** menu whatever the type of active window. The items on the **File** tab were seen in Section [1](https://learninghub.primer-e.com/books/primer-v7-user-manual-tutorial/chapter/1-opening-editing-and-saving-data-file-edit), namely the default setting for the initial directory on launch of PRIMER from the Windows desktop (in general there is not a strong incentive to change this from its default blank entry since, once closed, PRIMER will relaunch to the last used directory), and whether, on opening workspaces, they are displayed with full branches unfurled or not (this can take some time for very large workspaces). There is also the option to suppress the initial dialog about this feature, which is otherwise displayed every time a workspace is opened. When on this, or any of the other tabs, the *factory default* settings for PRIMER (for all tabs) can be re-instated by **Reset defaults**, and those defaults are as illustrated in the dialog boxes below.
The **Results** tab contains a single, little-used item, which just determines the page width for results – the number of characters in the fixed-spaced font used for Results windows. This is initially set to 200 and only comes into play with the few routines (SIMPER and DIVERSE, Sections [10](https://learninghub.primer-e.com/books/primer-v7-user-manual-tutorial/chapter/10-wizards-and-species-analyses-basic-mva-coherence-plots-matrix-display-simper) and [15](https://learninghub.primer-e.com/books/primer-v7-user-manual-tutorial/chapter/15-biodiversity-measures-and-tests-diverse-taxdtest)) which can generate wide lists of results. If this default is set to a smaller value than will allow a single span of results columns, they are split and listed a batch at a time. In practice, the DIVERSE routine essentially produces a matrix of samples (rows) by diversity indices (columns), so it will usually be preferable to direct this to a new worksheet, where it can be further plotted or analysed as a multivariate array (or be exported to Excel or a univariate statistics package). The **Updates** tab similarly concerns a single issue, this time a check box (new to PRIMER 7) to specify whether the software should automatically check the PRIMER-e server for existence of a maintenance update, and if it finds one, to ask the user whether they wish to download this at that point in time or not.
The **Graphs** tab is the most likely to be used on a regular basis, since this sets some of the global defaults for all plots. In the Symbol area, Shape, Colour and Size can be set for all graphs on which a single symbol type is plotted, e.g. a draftsman plot, Shepard diagram, an ordination graph which does not plot different symbol types by factor or, indeed, a bubble plot for a single variable with no factor used (with a factor, or for >1 variable, the bubble colours are determined by the appropriate Key dialog). The Bubble area therefore only controls the inner and boundary colours for the bubble key when it accompanies a bubble plot utilising more than one different coloured bubble, hence the default of a neutral grey with black boundary to avoid a misleading colour synchrony with any of the factor levels. The Bubble Scale box does, however, apply to all bubbles because it sets the size for a bubble at the maximum variable value given by the Bubble key. In fact, it provides the default for the (Bubble scale:) box in the **Graph>Special>Main**>Bubble area, and the Symbol Size default similarly sets the value in the Symbol area of the **Graph>Sample Labels & Symbols** tab (hence applies also to symbol sizes when plotted by factor levels). The Fonts Scale box likewise fixes the displayed default for (Overall font scale:) on the **Graph>General** tab, so applies to all fonts. Lastly this **Graphs** tab sets the default Histogram inner and boundary colours. It must be appreciated that default changes are not retrospective; they apply only to plots created after any default changes.
[](https://learninghub.primer-e.com/uploads/images/gallery/2024-09/screenshotpage222a.png)