# Tools vs. Edit menu
Both the **Edit** (see Section [1](https://learninghub.primer-e.com/books/primer-v7-user-manual-tutorial/chapter/1-opening-editing-and-saving-data-file-edit)) and **Tools** main menus carry out ‘housekeeping’ manipulations on a dataset (or a resemblance or variable information sheet, such as an aggregation file). The operations are usually rather straightforward, and with an obvious outcome, as opposed to the **Analyse** menu which contains the primary statistical routines. The main difference between **Edit** and **Tools** is that items on the main body of the **Tools** menu create a results window, and in most cases also produce a derived sheet of the same type, e.g. a new data sheet from a data sheet. (There are two miscellaneous items at the bottom of the **Tools** menu, **Stop Tasks** and **Options**, which do not fit into these rules, but are there because this is the conventional place for them in Windows applications). Items on the **Edit** menu, on the other hand, never produce a results window and change the entries on the current sheet in some way (sorting labels, inserting/deleting rows or columns, copying and pasting them, defining new factors or indicators associated with the sheet, etc.), and do not write the revised matrix to a new window. **Edit** operations on data sheets themselves therefore have a repeated **Undo** option (Section [1](https://learninghub.primer-e.com/books/primer-v7-user-manual-tutorial/chapter/1-opening-editing-and-saving-data-file-edit)), which will back-track through changes you have made to the data sheet entries. **Tools** operations can be re-run, however, perhaps with different options, simply by going back to the previous data sheet – which is always left unchanged, so no Undo facilities are provided. Some **Tools** items apply when the active window is either a data, resemblance or variable information sheet, though with some differences in operation, whereas others are specific to the window type.
Close any open workspace and open Groundfish ws, last seen in Sections [6](https://learninghub.primer-e.com/books/primer-v7-user-manual-tutorial/chapter/6-clustering-methods-cluster-simprof-unctree-krcluster) and [7](https://learninghub.primer-e.com/books/primer-v7-user-manual-tutorial/chapter/7-managing-the-workspace-and-plotting-window-file-view-multi-plot-plots), demonstrating cluster analysis. If not available, open the data file Groundfish density in directory C:\Examples v7\ Europe\Groundfish, of species counts from 277 samples in 9 sea areas of the NW European shelf (factor area), and also the variable information file Groundfish taxonomy, defining the Linnaean taxonomy of genera, families, orders and classes for the 93 groundfish species monitored. Create a resemblance matrix (Resem1) in any way you like. Now compare the choices on the **Tools** menu when the active window is a data, resemblance or variable information sheet.
[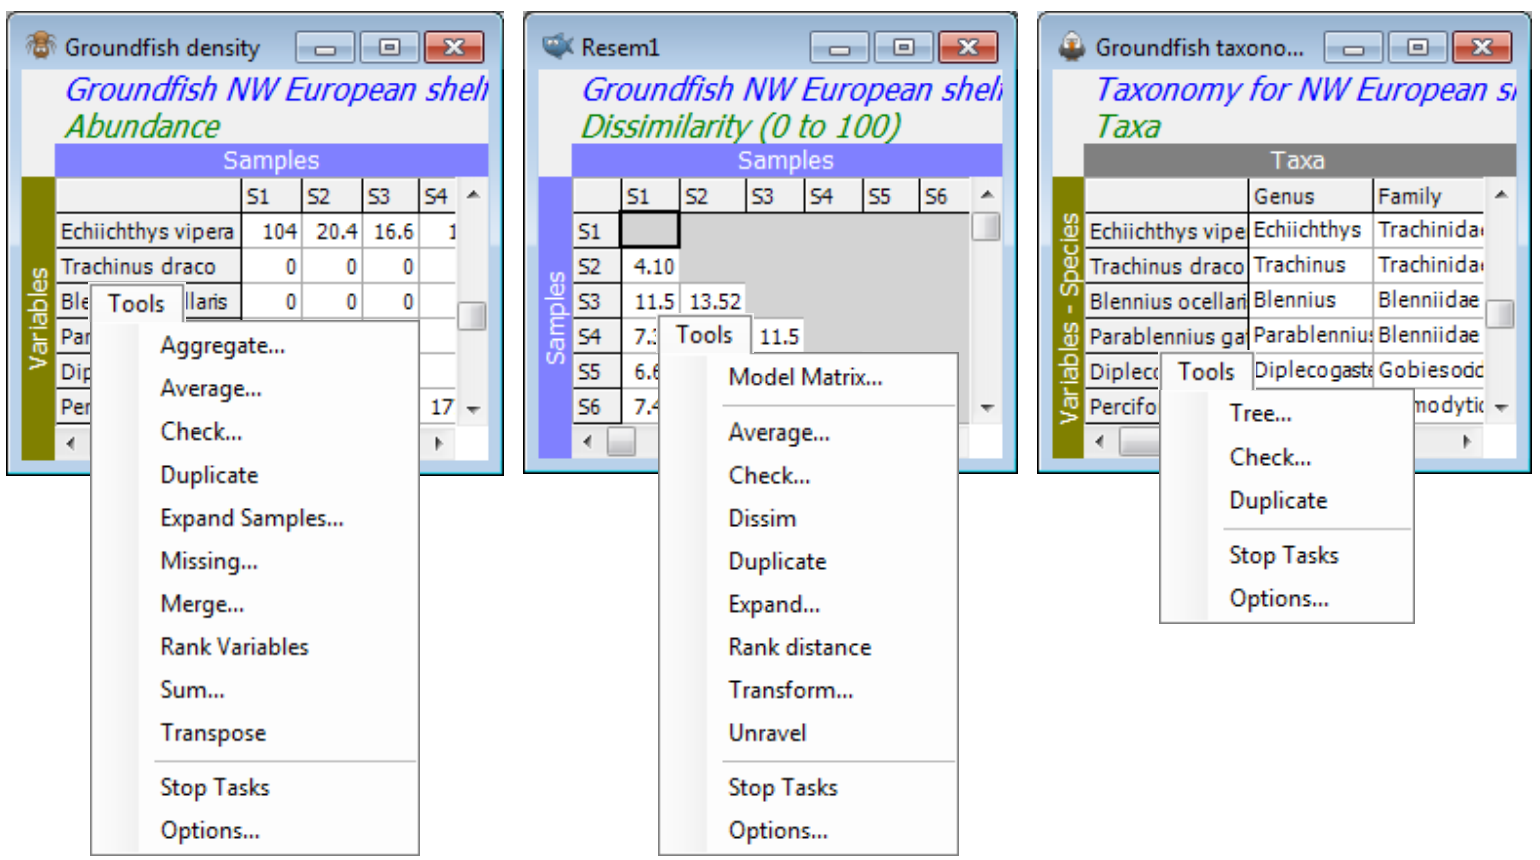](https://learninghub.primer-e.com/uploads/images/gallery/2024-08/screenshotpage203a.png)
The section works through the choices in (very roughly) alphabetic order, with a few transpositions where menu items or data sets are better exemplified in combination. One or two more specialised routines will be deferred until they are needed (e.g. **Tools>Expand** in Section [14](https://learninghub.primer-e.com/books/primer-v7-user-manual-tutorial/chapter/14-further-matching-of-multivariate-patterns-relate-2stage-best-mvdisp)) and the **Average** (and **Sum**) options have been met sufficiently often in previous pages only to need an initial recap.