# Trajectories split & then sequence animated
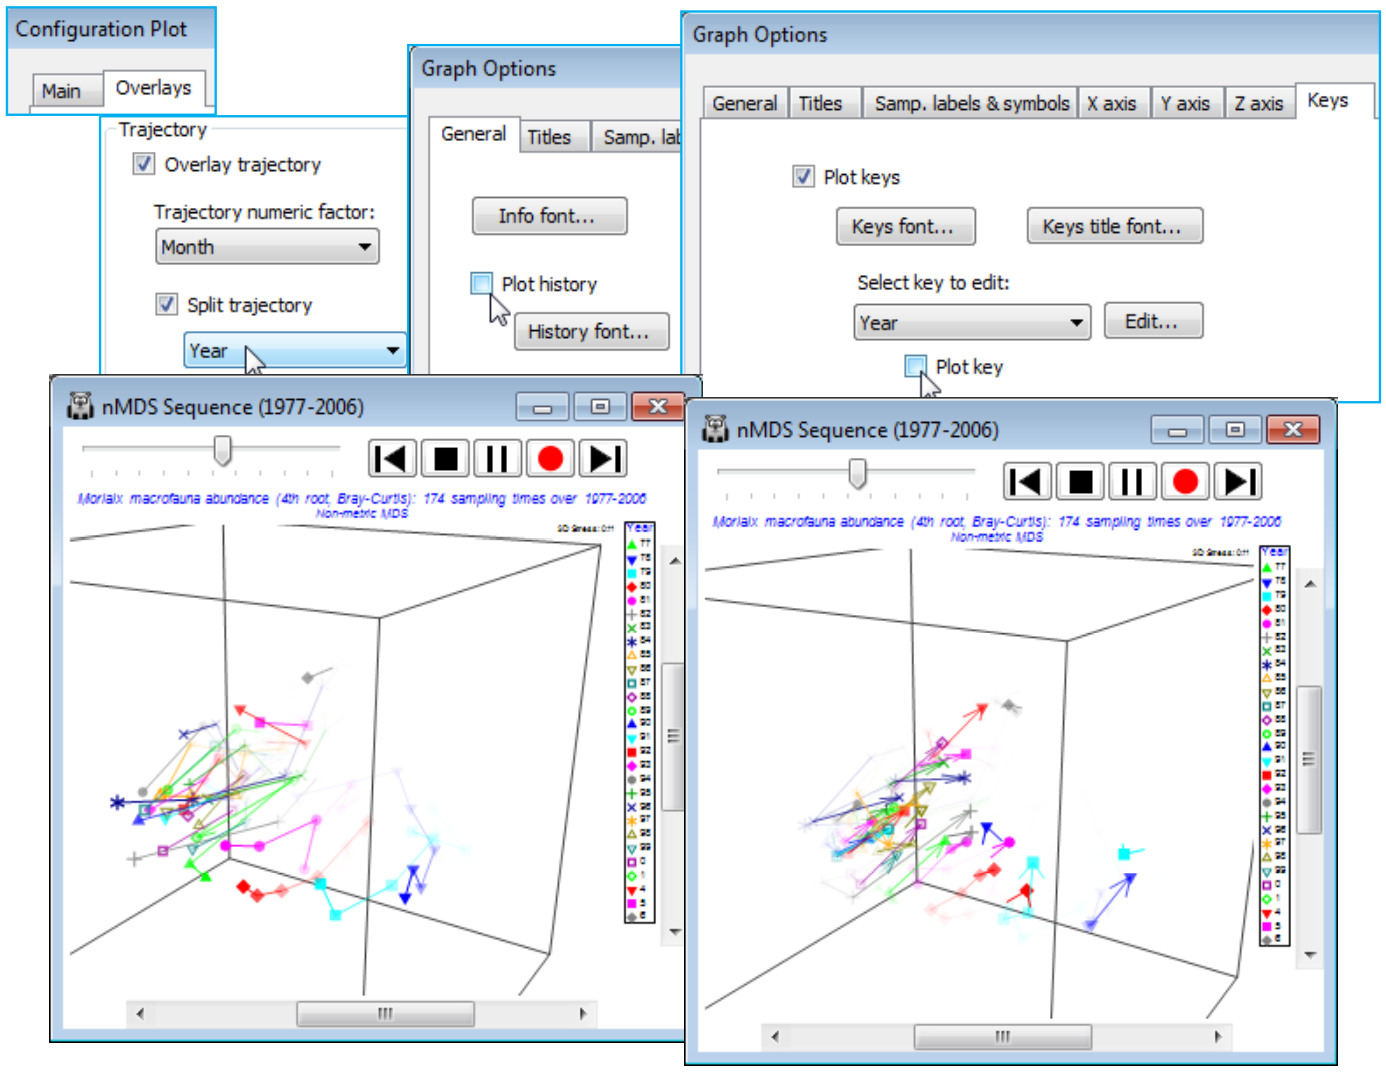
In fact, if the animation is repeated with trajectories running across months, separately drawn for each year, using the option discussed earlier to split the trajectories, then the scale of the seasonal cycle can be made visually apparent in a dynamic way. Firstly, take **Graph>Special>Overlays**> (Trajectory✓Overlay trajectory)>(Trajectory numeric factor: Month)&(✓Split trajectory>Year), then you might like to remove extraneous information from the plot, such as the History box on the **General** tab and the line keys on the **Keys** tab, unchecking (✓Plot key) under the second entry for (Select key to edit: Year). Then the animation **Graph>Special>Main**>(Sequence✓Run sequence)> (Factor: Month)&(Decay: 0.5) gives a dynamic display of the seasonal cycle running in parallel across the years.
[](https://learninghub.primer-e.com/uploads/images/gallery/2024-07/screenshotpage131a.png)
Save the workspace as Morlaix ws and close.