# Transforms in Matrix display
The next dialog box on **Matrix display** is (Transformation: ), with default of Square root. This in effect runs the routine **Pre-treatment>Transformation(overall)** and thus offers the choices of None, Square root, Fourth root, log(X+1) and Presence/absence. The chosen transform is naturally applied both to the full data matrix submitted to **Matrix display** and to the reduced matrix (if a reduction is specified) which will form the entries of the shade plot itself. After transforming the full matrix, Bray-Curtis similarities will be computed among samples and used to determine the ordering and/or clustering of the samples on the *x* axis of the shade plot. On the *y* axis, the ordering and/or clustering of the (reduced) species set does not use this transform (or any transformation). The definition of similarity among species uses the Index of Association (IA), as defined near the start of Section [5](https://learninghub.primer-e.com/books/primer-v7-user-manual-tutorial/chapter/5-resemblance-similarities-dissimilarities-and-distances), and this incorporates a species standardisation, which is usually calculated on untransformed data. The requirement for computation of IA on the original, untransformed data means that **Wizards>Matrix display** should generally be run on the raw data, and if a transformed matrix is submitted to it, this will elicit a warning box. You can happily ignore that if you wish to compute the similarities among species by standardising the transformed data – and there will be occasions when this is a reasonable thing to try. It would usually follow, of course, that when submitting transformed data you do not ask **Matrix display** for a further transformation step!
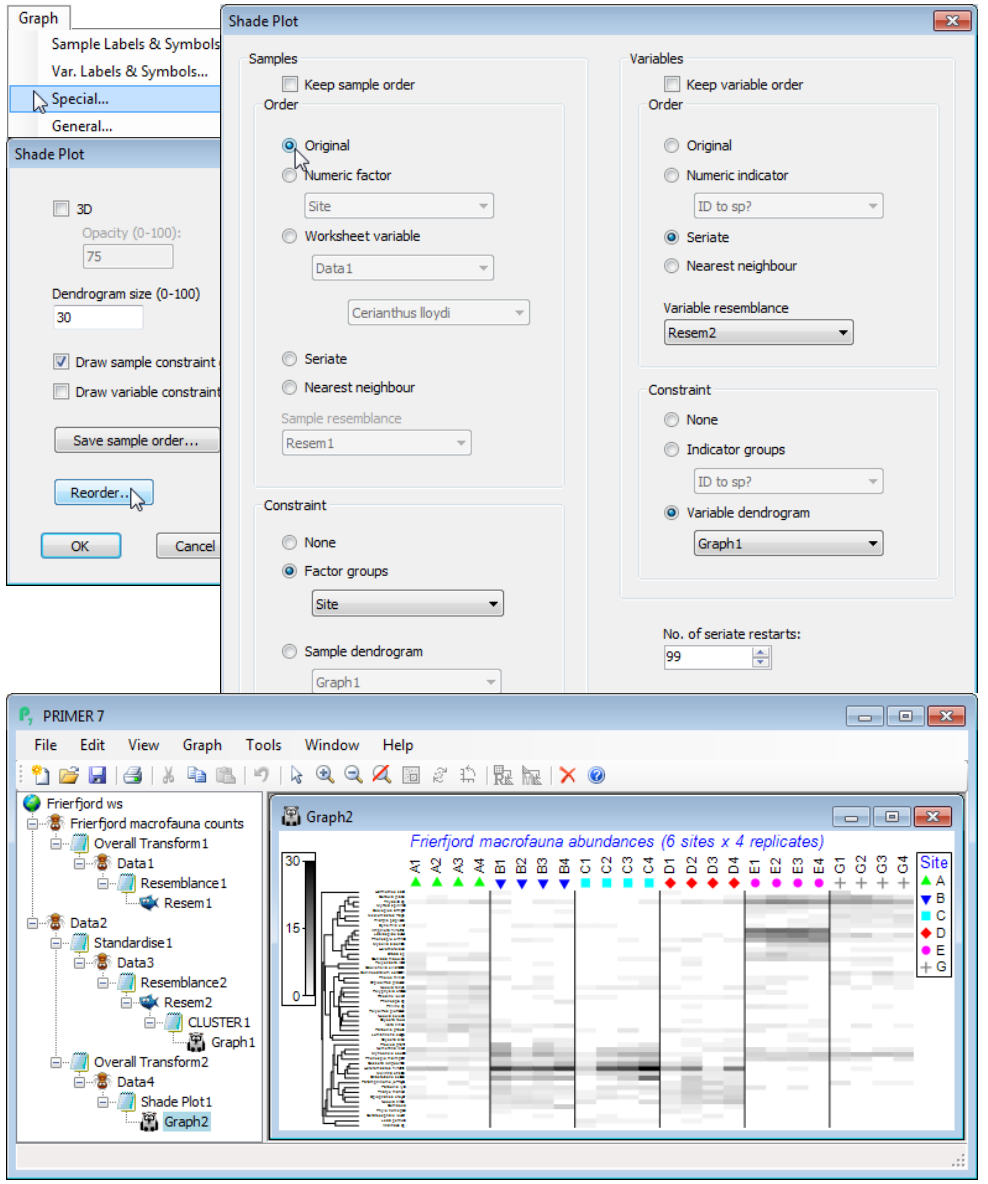
Note that there is no facility for changing the choice of sample similarity away from Bray-Curtis, or defining similarity among samples by anything other than the Index of Association, within the **Wizards>Matrix display** routine. That is not to say that other measures might not be sensible or desirable in some cases but you will then need to create the files to be input into a direct run of **Plots>Shade Plot**. You can see the steps created by the wizard in the Explorer tree below, along with the **Graph>Special>Reorder** dialog needed to change the *x* axis to the original sample order.
[](https://learninghub.primer-e.com/uploads/images/gallery/2024-08/screenshotpage179aa.png)