# UNCTREE options
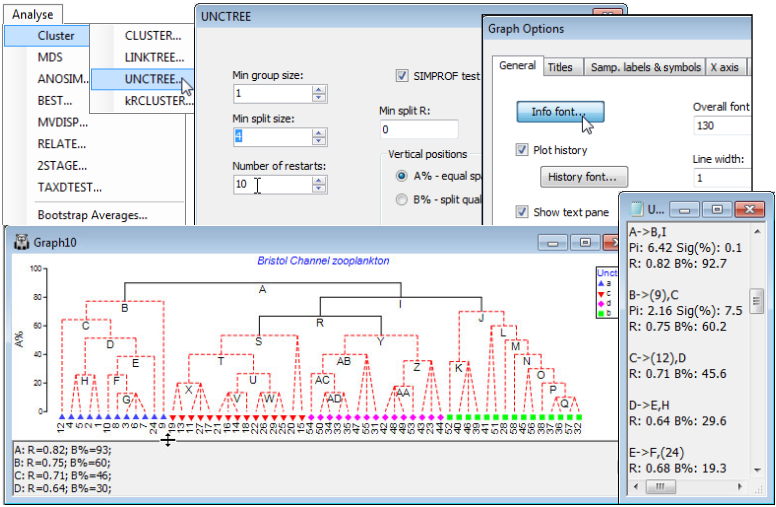
Using the Bristol Channel zooplankton workspace which should still be open, and with active sheet the Bray-Curtis similarities on fourth-root transformed data, run **Analyse>Cluster>UNCTREE**> (Min group size: 1)&(Min split size: 4)&(Number of restarts: 50)&(Min split R: 0)&(✓SIMPROF test)&(Vertical positions•A% – equal spaced) and take the defaults on the SIMPROF dialog, which is exactly that described for the CLUSTER routine above. Add factor name: Unctree, which holds the SIMPROF group labels which can then be compared with those for the previous dendrograms. Here, *Min group size: 1* imposes no constraint on how small a group can be, and *Min split R: 0* effectively takes out this stopping rule (max *R* will always be > 0), but *Min split size: 4* does come into play, so that once a group reduces to three samples it is not further divided. SIMPROF would have the ability to identify a group of three as heterogeneous – though the differences must be stark for it to do so – so there is no strong reason to impose this constraint. (However, SIMPROF cannot ever generate a significant result for a group of two; see CiMC, Chapter 3). The main guide here to interpretation will be the series of SIMPROF tests, with the parts of the tree drawn as red dashed lines again having no statistical support. In the absence of other strong information to the contrary, interpretation should thus be confined to the groups identified by the continuous black lines.
[](https://learninghub.primer-e.com/uploads/images/gallery/2024-06/screenshotpage99a.png)