# Zoom & MDS subset plots
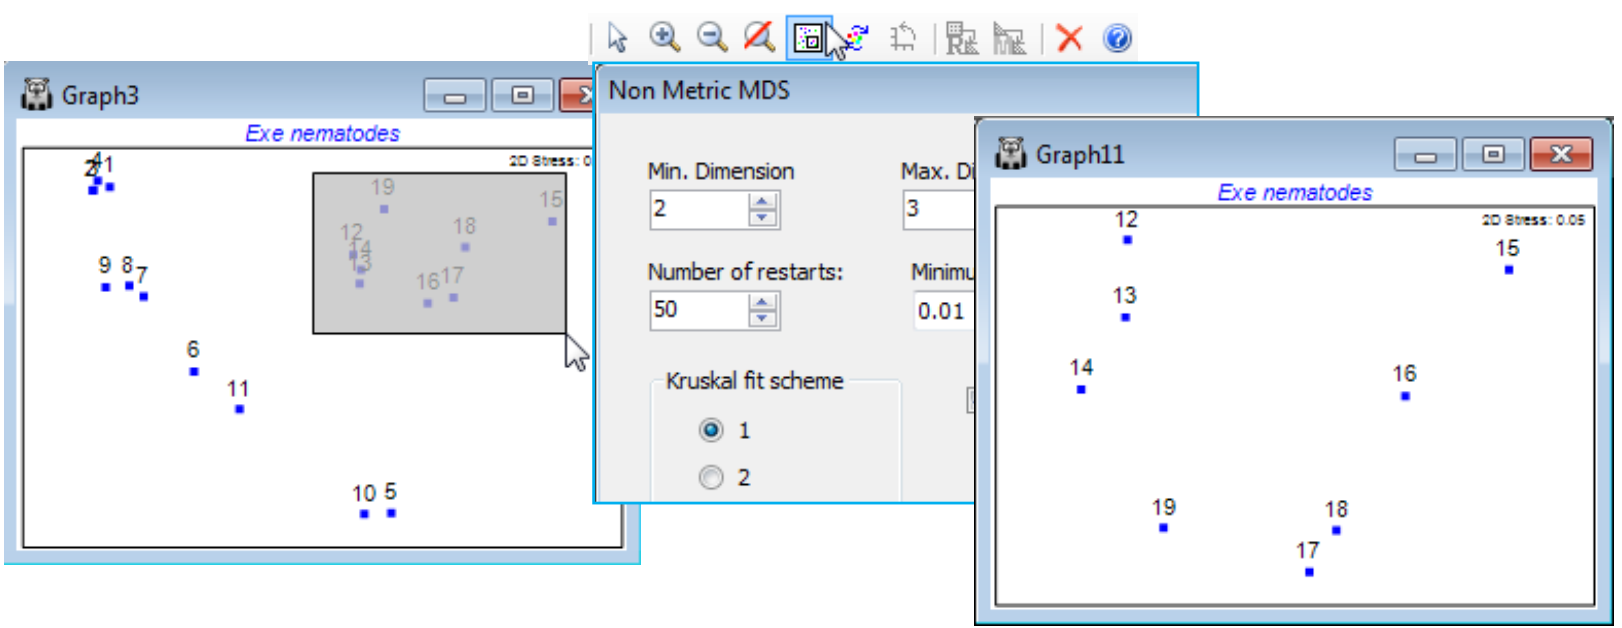
It is scarcely necessary here, with only 19 samples, to zoom in on part of the plot in order to see the detailed structure, though this is possible using the **Zoom In**, **Zoom Out** and **Cancel Zoom** options on the **Graph** menu (also accessible from the [](https://learninghub.primer-e.com/uploads/images/gallery/2024-06/zoominicon.png), [](https://learninghub.primer-e.com/uploads/images/gallery/2024-06/zoomouticon.png) and [](https://learninghub.primer-e.com/uploads/images/gallery/2024-06/cancelzoomicon.png) icons on the Tool Bar), as described for zooming in on dendrograms in Section [6](https://learninghub.primer-e.com/books/primer-v7-user-manual-tutorial/chapter/6-clustering-methods-cluster-simprof-unctree-krcluster), and this may be useful for very cluttered MDS plots, with rather too many points. However, it is not the only, or even the best, possibility. If attention is to be focussed on only a subset of points, then it is desirable for the 2-d ordination to display those points in the best possible relationship to each other, matching their (smaller set of) dissimilarities. This can be accomplished more accurately, since it is no longer necessary to display their relations with all the omitted points. In other words, the MDS should be repeated from scratch on the subset, and one way of carrying this out is to draw a box on the MDS (with cursor as pointer [](https://learninghub.primer-e.com/uploads/images/gallery/2024-07/pointer2icon.png) ), clicking and dragging a rectangle around the required subset of points, then taking **Graph>MDS Subset** (or its icon [](https://learninghub.primer-e.com/uploads/images/gallery/2024-07/subseticon.png) ). This automatically selects the surrounded points from the resemblance matrix and displays the MDS dialog box (normally obtained by **Analyse>MDS**>…). For the Exe nematode data, even though the 2-d stress for the full set of samples in Graph3 is low (at 0.05), a re-run on sites 12-19 gives a more accurate display of the site 12-14 relationships (a SIMPROF test, as seen in Section [6](https://learninghub.primer-e.com/books/primer-v7-user-manual-tutorial/chapter/6-clustering-methods-cluster-simprof-unctree-krcluster), actually divides site 14 from 12 & 13, not something that would be expected from the original Graph3 display, in which 14 appears to sit between 12 and 13).
[](https://learninghub.primer-e.com/uploads/images/gallery/2024-07/screenshotpage119b.png)