3. PERMANOVA vs adonis2 in R
- 3.1 Compare example output
- 3.2 Results don't match
- 3.3 How does PERMANOVA do it?
- 3.4 How does adonis2 do it?
- 3.5 What about $R^2$ values?
- 3.6 Summarising the comparison
3.1 Compare example output
PERMANOVA vs 'adonis2'
It is instructive to look at a particular example. Let's compare the results we get using a routine in R and a routine in PRIMER that should (on the face of it) do the same thing.
We'll compare:
- PERMANOVA (a routine in the PERMANOVA+ add-on package for PRIMER) versus
- 'adonis2' (a function in the 'vegan' package for R, Oksanen et al. (2022) )
These are both (purportedly) designed to do PERMANOVA . More specifically, they should do the following:
- Perform a partitioning of multivariate variation in the space of a chosen resemblance measure in response to a multi-factor ANOVA-type study design.
- Construct a test of significance for each term in the ANOVA model using a (pseudo) F-ratio test-statistic , and
- Calculate a p-value for each term empirically, using permutations.
For details regarding the PERMANOVA methodology, see Legendre & Anderson (1999) , McArdle & Anderson (2001) , Anderson (2001a) and Anderson (2017) . For details regarding correct construction of the test-statistic and estimation of components of variation using expectations of mean squares, see Cornfield & Tukey (1956) , Hartley (1967) , Rao (1968) , Searle (1971) , Hartley et al. (1978) and Searle et al. (1992) . For details regarding permutation methods, see Anderson & Legendre (1999) , Anderson (2001b) and Anderson & ter Braak (2003) .
Example data
We will consider an example dataset of assemblages colonising holdfasts of the kelp Ecklonia radiata in a 3-factor hierarchical experimental design. There were n = 5 holdfasts collected from each of 2 areas (tens of meters apart) at each of 2 sites (hundreds of meters to kilometers apart) from each of 4 locations (hundreds of kilometers apart) in rocky reef habitats along the northeastern coast of New Zealand ( Anderson et al. (2005a) , Anderson et al. (2005b) ).
There were 351 taxa from 15 different phyla quantified in this study. Here, we shall focus only on the phylum Mollusca (105 taxa).
Our interest lies in quantifying the degree of turnover in the identities of mollusc species at different spatial scales, as measured by the Jaccard resemblance measure. This a fully hierarchical sampling design with three spatial factors, as follows:
- Locations (random with 4 levels: Berghan Point, Home Point, Leigh and Hahei)
- Sites (random and nested in Locations, with 2 sites per location)
- Areas (random and nested in Sites, with 2 areas per site)
Areas are therefore also (necessarily) nested in Locations.
For a detailed set of steps you can take to analyse these data in PRIMER with PERMANOVA+, see Chapter 7 'Run a PERMANOVA' in the online resource 'A Quick Guide to PRIMER'.
¶ These data are provided as an example with the PERMANOVA+ add-on for PRIMER in the file called hold.pri in the folder named 'HoldNZ' inside the 'Examples add-on' folder. This folder can be downloaded directly from inside PRIMER with PERMANOVA+ by clicking Help > Get Examples add-on....
3.2 Results don't match
When we compare the output obtained using the two different pieces of software, we can see that there are fundamental differences in the results (Fig. 1). They don't match!
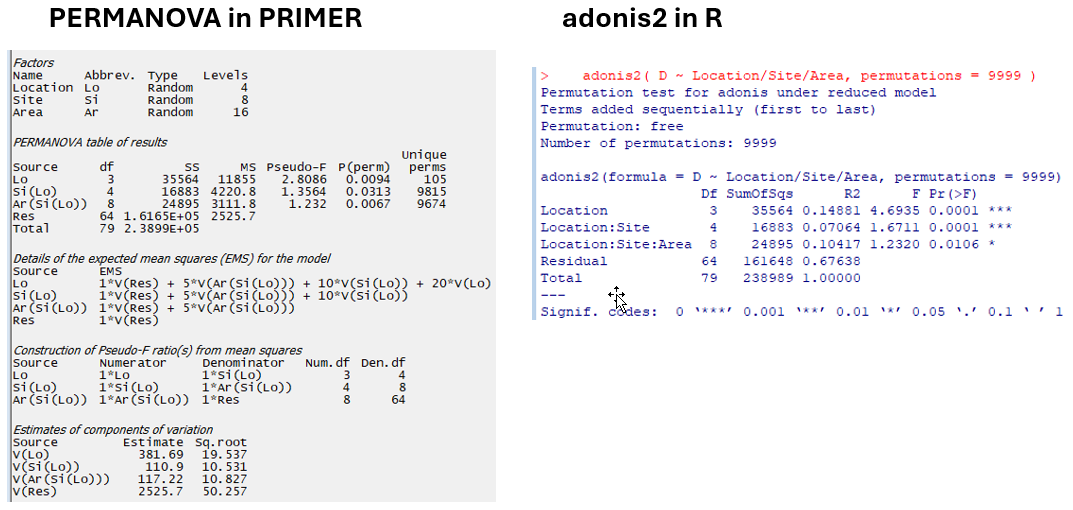 Fig. 1. Comparison of results for the holdfast data using PERMANOVA in PRIMER and adonis2 in R.
More specifically, although the degrees of freedom and the sums of squares are effectively identical (in this particular case), the pseudo-F statistics and the p-values are not (Fig. 2).
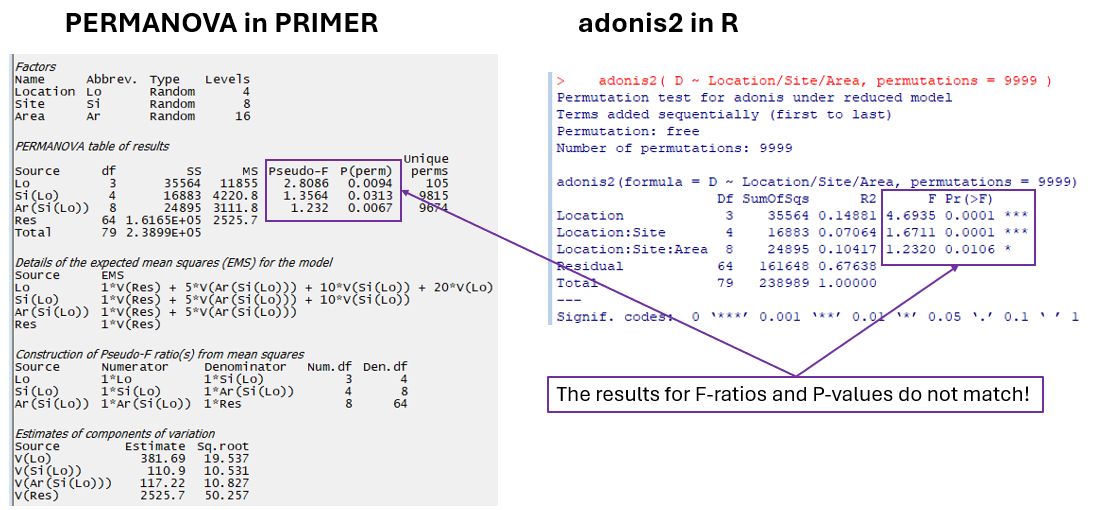
Fig. 2. Pseudo-F ratios and p-values do not match.
Why don't we get the same results as PERMANOVA in PRIMER when we run PERMANOVA using the adonis2 function in R? Unfortunately, the results obtained using adonis2 are incorrect. Basically, adonis2 takes no notice of whether factors are fixed or random. The adonis2 function gives you no way of specifying the types of factors you are dealing with; adonis2 treats all factors as if they are fixed. In contrast, PERMANOVA does the analysis correctly by reference to the full study design specified by the end-user.
3.3 How does PERMANOVA do it?
Following the PERMANOVA table of results, a suite of key additional details regarding the analysis can be seen in the PERMANOVA output file. These details highlight what makes the implementation of PERMANOVA in PRIMER so unique, surpassing all other software tools that we know of in its handling of multi-factorial sampling and experimental designs.
The implementation of PERMANOVA in PRIMER pays very careful attention to whether factors are fixed or random and whether they are crossed with or nested within other factors in the study design. The construction of correct test-statistics and permutation algorithms for every term in the model rely ciritically on the expectations of the mean squares.
Additional details in the PERMANOVA output file include (Fig. 3):
- details of the expected mean squares (EMS) for each term in the model;
- the construction of the pseudo-F ratios for each term in the model from the appropriate mean squares (along with the associated numerator and denominator degrees of freedom); and
- estimates of the components of variation for each term in the model in the space of the resemblance measure.
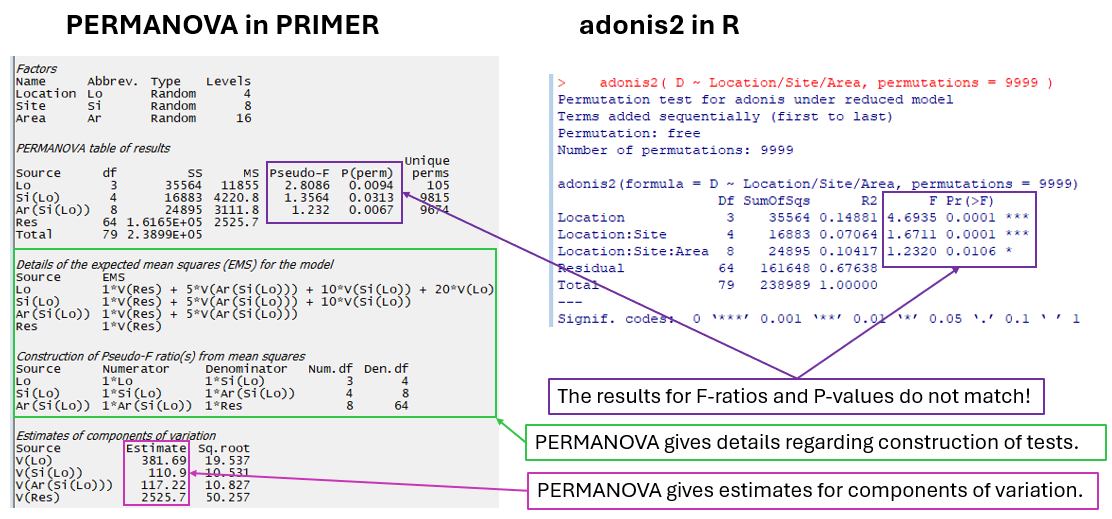 Fig. 3. Additional details provided in the output from a PERMANOVA analysis.
Expectations of mean squares
This portion of the output file shows which components of variation are involved (may contribute towards) the expectation of any given mean square (MS). For example, consider the mean square for the factor 'Location'. It is clear from the above output that variation among replicate holdfasts ('V(Res)'), Areas ('V(Ar(Si(Lo)))'), Sites ('V(Si(Lo))') and Locations ('V(Lo)') are all involved and hence can potentially contribute towards the expectation of the mean square (EMS) for Location.
Why do we bother with this? When we test individual terms in our model, it is absolutely vital that we build an F-ratio that focuses only on testing the null hypothesis associated with the term of interest. We must make sure not to confound its source of variation with other potential sources of variation inherent in our experimental design when we perform each individual test.
Construction of pseudo-F ratios
PERMANOVA in PRIMER uses the EMS information in order to contruct the correct pseudo-F ratio for the test of any individual component of variation (term) in any multi-factor model. This is done with careful consideration of fixed and random factors in mixed models and/or hierarchical (nested)-type study designs. For example, it is appropriate, in this three-factor nested study design, to construct the individual tests as follows:
| Source | Construction of pseudo-F statistic |
|---|---|
| Location | $F$$Lo$ = $MS$$Lo$ / $MS$$Si(Lo)$ |
| Site | $F$$Si(Lo)$ = $MS$$Si(Lo)$ / $MS$$Ar(Si(Lo))$ |
| Area | $F$$Ar(Si(Lo))$ = $MS$$Ar(Si(Lo))$ / $MS$$Res$ |
It would be incorrect, of course, to test 'Location' by placing $MS$$Lo$ directly over the residual mean square ($MS$$Res$) as the denominator. That approach will not account correctly for the other sources of variation (Areas and Sites) that may indeed contribute towards the mean square for 'Location'. This is true for multivariate dissimilarity-based analysis, just as it is for classical univariate ANOVA.
Permutable units
The denominator of the pseudo-F ratio also points us directly towards the correct permutable units for the test ( Anderson (2001b) ; Anderson & ter Braak (2003) ). By 'permutable units', we mean the items that should be considered 'exchangeable' under a true null hypothesis. Hence, if we are interested in testing the factor of 'Location', we must permute whole sites (there are 8 of them, and we need to keep the replicates within each site together as a unit) randomly across the 4 locations. It is not appropriate to permute replicate holdfasts just anywhere randomly across the entire study design for the test of 'Locations', just as it is not appropriate to use the residual mean square directly as the denominator for the test of 'Locations'.
The implementation of PERMANOVA in PRIMER always uses expected mean squares to get a correct rigorous test for every term in the model; specifically:
- to construct the correct pseudo-F ratio; and
- to implement a correct permutation algorithm, accounting for other terms in the model.
Permutation algorithm
P-values are obtained by PERMANOVA in PRIMER using permutation algorithms that are constructed specifically for each term in the model, after identifying:
- the correct permutable units (referencing the F-statistic's construction); and
- the correct reduced-model residuals, accounting for other terms in the model.
Using reduced-model residuals is the default in PERMANOVA. Alternatively, one can choose to permute raw data or full-model residuals, which are less optimal, but are fine asymptotically. Even so, this does not get away from the need to ascertain the correct permutable units, which is not really negotiable if you want to achieve the correct test for your study design.
Of course, each term will require its own denominator and its own permutation algorithm, which will depend on whether terms are fixed or random, whether there are nested terms, covariates or interactions, etc. For unbalanced cases, the 'Type' of sum of squares is also very important for the partitioning, the expectations, and subsequent tests.
Degrees of freedom
The additional information provided in the output also helps us to see where the degrees of freedom (df) from our full study design 'ended up' in the PERMANOVA analysis. From an experimental design point of view, it is important to try to maximise the denominator df, whenever possible, in order to obtain better power for tests of the term(s) of interest. For example, if we wanted to get more power to test for significant variability at the scale of Locations, then increasing the number of holdfasts per area would do little to help. We would be far better off increasing the number of sites sampled per location (even at the expense of reducing the number of holdfasts collected per area), precisely because the mean square for 'Site' is used as the denominator in the pseudo-F statistic constructed by PERMANOVA to test for variation among Locations.
Components of variation
Finally, the estimated components of variation are also extremely useful (provided at the bottom of the output file). These are calculated in a directly analogous way to univariate ANOVA estimators, relying (once again) on the expectations of the mean squares. The column labeled 'Estimate' is in squared dissimilarity units, and its square root ('Sq.root', interpretable as a sort of standard deviation in the space of the resemblance measure) is also provided.
In the present example, we can see that the greatest variation occurs at the smallest spatial scale - from holdfast to holdfast within a given area (i.e., the square root of 'V(Res)' is 50.257 in Jaccard % dissimilarity units). This means that holdfasts that are just a 'fin-kick' away (or so) from one another may share little more than half of their mollusc species! The sources of variation (in order of importance, as quantified by the PERMANOVA model) are: Residual > Location > Area > Site.
The values in the 'Estimate' column can be expressed (optionally) as percentages of the total (provided there are no negative estimates of variation in a given model), thusly:
| Source | Estimate (based on EMS) | Percentage |
|---|---|---|
| Location | 381.69 | 12.17 % |
| Site | 110.90 | 3.54 % |
| Area | 117.22 | 3.74 % |
| Residual | 2525.70 | 80.55 % |
| Total | 3135.51 | 100.00 % |
It is not uncommon in ecological field studies for the residual component of variation to be large relative to other sources of variation.
For more information about all of these key additional details provided in the PERMANOVA output file, please consult the PERMANOVA+ manual.
3.4 How does adonis2 do it?
The adonis2 function (in the vegan package in R) will provide a partitioning of the total sum of squares according to a given ANOVA design. However, adonis2 constructs pseudo-F ratios for all of the terms in any model using the residual mean square ($MS$$Res$) as the denominator (yikes!). In many cases, this will (clearly) give you incorrect results.
Thus, adonis2 has two fundamental drawbacks:
- It does not use expectations of mean squares to construct the correct F tests.
- It does not identify the correct permutable units for tests of individual terms in the model.
This means there are really important limits on what kinds of ANOVA models adonis2 can actually (safely) be used for. Specifically, adonis2 will not handle correctly any designs that have random factors or nested factors. It also may be problematic for cases where there are continuous covariates and/or imbalance in the study design, whenever these features affect the EMS (i.e., almost always).
In effect, adonis2 assumes everything is a fixed factor, and a sequential (Type I) SS is done. This function is therefore also quite limiting for analysing unbalanced ANOVA designs or designs with quantitative covariates. In contrast, PERMANOVA in PRIMER offers partitioning using Type I, Type II or Type III SS (your choice).
Are there cases when it might be ok to use adonis2?
An analysis done using adonis2 in R should be ok if you have a single factor (a simple one-way ANOVA design). It might be ok(?) if you happen to have all fixed factors in a fully balanced, fully crossed design, with no random factors, covariates or nested terms. (Caveat: I can make no promises about that)!
Clearly, as previously articulated in Chapter 2 above, R is a wonderful statistical programming language, with loads of packages that are constantly evolving, and with many amazing contributors, so maybe in the future the functionality of adonis2 will be improved, or a new package will be written. At the moment, however, you cannot trust R to analyse PERMANOVA models correctly except (perhaps?) in some very special cases (i.e., crossed fixed factors only, fully balanced designs).
In contrast, you can completely trust the implementation and resulting output provided by PERMANOVA in PRIMER for any design.
3.5 What about $R^2$ values?
Another clear difference between the output given by adonis2 by comparison with the output given by PERMANOVA in PRIMER is the fact that adonis2 provides an additional column, headed 'R2'. These are values of $R^2$ for a given term in the model, calculated directly as the ratio of an individual term's explained sum of squares (SSterm) divided by the total sum of squares (SStotal, Fig. 4). Unfortunately, the inclusion of this column is, in my view, misguided.
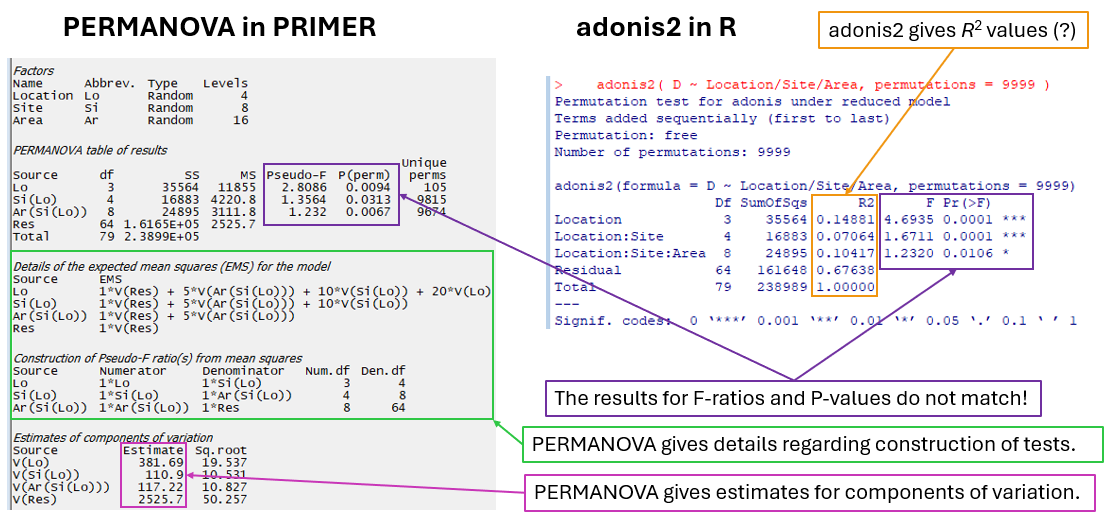 Fig. 4. PERMANOVA gives estimates for components of variation based on EMS, whereas 'adonis2' gives $R^2$ values in the output.
Why doesn't PERMANOVA output $R^2$ values?
Sums of squares (SS) are used to partition variation in the multivariate data cloud in the space of the resemblance measure according to each term in the PERMANOVA model. However, these SS values cannot be compared directly with one another, quite simply because they have different degrees of freedom (df). For example, the SS for a term with 64 df would automatically be expected to 'explain more' than a term with just 3 df. To put this quite simply in another way: a sum of squares is not the same thing as a variance.
In addition, the mean squares (MS) are also not able to be compared directly with one another. As already outlined above, the expectations of mean squares can (and very often do) include more than one source of variation, and this also must be taken into account when we wish to quantify the relative sizes and (hence) the relative importance of the effects (or terms) in any given model.
Values of $R^2$ can never be interpreted directly as 'effect sizes' in an ANOVA context. That is why we don't use raw $R^2$ values (the term's SS divided by the total SS) in order to quantify the relative importance of individual terms from a PERMANOVA (or ANOVA) model. This would be a mistake with the potential to mislead, even for a classical univariate ANOVA. (In contrast, it may be fine to use $R^2$ values in ordinary least-squares regression models for comparative purposes, considering one variable at a time, where every predictor variable is on an equal footing and has just 1 df.)
As it is potentially quite misleading to include $R^2$ values in an ANOVA table, PERMANOVA in PRIMER does not provide them in the output. Instead, it uses the EMS to carefully estimate components of variation for each term in the model. These components can indeed be directly compared to assess the relative importance/contribution of individual terms (sources of variation) in the model.
3.6 Summarising the comparison
In summary:
- I recommend using PERMANOVA in PRIMER.
- I do not recommend using adonis2 in R.
- Except in very limited circumstances, adonis2 does not construct:
- (i) correct F-ratios; or
- (ii) correct permutation algorithms.
- The implementation in adonis2 is far too limiting (it can only be correct for one-way cases, and possibly correct for fixed factors only in fully crossed, fully balanced designs).
- Furthermore, $R^2$ values for individual terms in ANOVA models are not a sensible way of comparing their relative importance.
It would be exhausting, fruitless and probably upsetting to list all of the papers that have used adonis2 (or adonis, its predecessor) in R to perform a PERMANOVA for a complex design that have failed to notice these important problems and limitations. No-one can really be blamed for trying to use adonis2. It seems (on the face of it) like it should work. It has been used to run all sorts of designs and gets cited rather a lot. Unfortunately, the results of analyses done using adonis2 might be wrong, and the inferences drawn misleading, depending on the model/study design.
In deference to the excellent people who wrote the adonis2 routine (it's clearly a good thing that they created it), I feel certain that they (probably) never intended for this function to be used to analyse complex experimental designs with random factors, nested factors, etc. It would be helpful for the truly limited scope of adonis2 to be more plainly acknowledged somewhere in the documentation and/or description of the routine, so that end-users are not mis-led. Perhaps a future R package will address some of these issues.
Importantly, the PERMANOVA routine in PRIMER allows the user:
- to specify whether factors are fixed or random,
- to specify whether a factor is nested in one or more other factors,
- to test interaction terms,
- to include one or more quantitative covariates in the analysis,
- to remove individual terms from a model or to perform pooling,
- to correctly analyse:
- fixed models, random models & mixed models
- user-specified contrasts
- BACI designs (before-after/control-impact),
- asymmetrical designs (e.g., in environmental impact studies),
- randomised blocks,
- split plots,
- hierarchical designs,
- repeated measures,
- unbalanced designs (Type I, II or III sums of squares),
- ... and more.