# 15.5 Split data sheet by factor/indicator
In PRIMER 8 there is a new tool, accessed by clicking **Tools** > **Split Data...**, which allows you to split a data sheet into several separate data sheets, corresponding to:
- separate groups of ***samples***, based on a ***factor***; or
- separate groups of ***variables***, based on an ***indicator***.
This is a simple tool, but a helpful one. Having this tool saves one from having to select each group individually, then duplicate them into a new sheet, one group at a time.
For example, consider the data set of fish surveys from New Zealand, discussed in [section 10.4](https://learninghub.primer-e.com/link/1049) above. (Data are located in the file 'NE_NZ_fish_counts.pri', found in the 'Example_P8' > 'NE_NZ_fish' folder.) Visual underwater surveys of fish assemblages were done at four different locations along the north-eastern coast of New Zealand: Berghan Point, Home Point, Leigh and Hahei. Suppose now we would like to examine trends in assemblages through time, but do this separately for each of these four different locations.
From the fish dataset, click **Tools** > **Split Data...**, like so:
[![08a._Tools_Split_Data_fish_[i].png](https://learninghub.primer-e.com/uploads/images/gallery/2025-12/scaled-1680-/08a-tools-split-data-fish-i.png)](https://learninghub.primer-e.com/uploads/images/gallery/2025-12/08a-tools-split-data-fish-i.png)
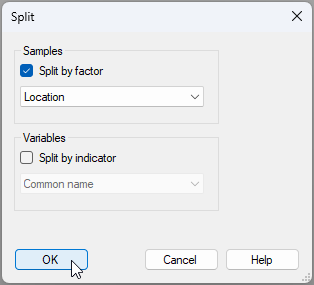
We can then choose to split the data based on the factor of 'Location', as shown in the 'Split' dialog window below, then click '**OK**'.
[](https://learninghub.primer-e.com/uploads/images/gallery/2025-07/8b-split-data-dialog-window-fish.png)
In our Explorer tree, we then see four new data sheets, one for each of the four locations:
[![08c._Post_data_split_fish_[i].png](https://learninghub.primer-e.com/uploads/images/gallery/2025-12/scaled-1680-/08c-post-data-split-fish-i.png)](https://learninghub.primer-e.com/uploads/images/gallery/2025-12/08c-post-data-split-fish-i.png)
Note that the sheets produced by this operation each have a new ***title*** (see also **Edit** > **Properties**) that reflects:
- the factor on which the split was made; and
- the relevant corresponding group for each resulting data sheet.
For example, the title for 'Data4' is given as 'New Zealand Fish Visual Surveys - Location: Home.Point', *viz.:*
[](https://learninghub.primer-e.com/uploads/images/gallery/2025-07/08d-new-title-home-point.png)
Of course, you can also change the name of the data sheets themselves if you wish. For example, you can change the name of the sheet called 'Data4' to 'Home.Point' by clicking **File** > **Rename Data**.