# 15.6 Line plots for samples
There is a new facility in PRIMER 8 to create **Line plots** in two different ways:
- with one line for every ***variable*** (across all samples); or
- with one line for every ***sample*** (across all variables).
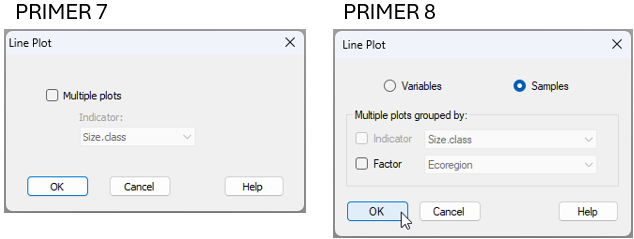
This is a considerable improvement on the line plot dialog in PRIMER 7, which only could be implemented to draw lines for variables (Fig. 15.6).
[](https://learninghub.primer-e.com/uploads/images/gallery/2025-07/09e-line-plot-compare-p7-p8.png)
*Fig. 15.6 Comparison of the **Plots** > **Line Plot...** dialog window in PRIMER 7 (at left) vs PRIMER 8 (at right).*
We saw this tool earlier in [section 13.3](https://learninghub.primer-e.com/link/1063), in the analysis of mussel size-classes at different sites in the Gulf of Alaska (the data file is called 'Gulf_of_Alaska_mussels.pri', located in the folder 'Examples_P8' > 'Gulf_of_Alaska_mussels').
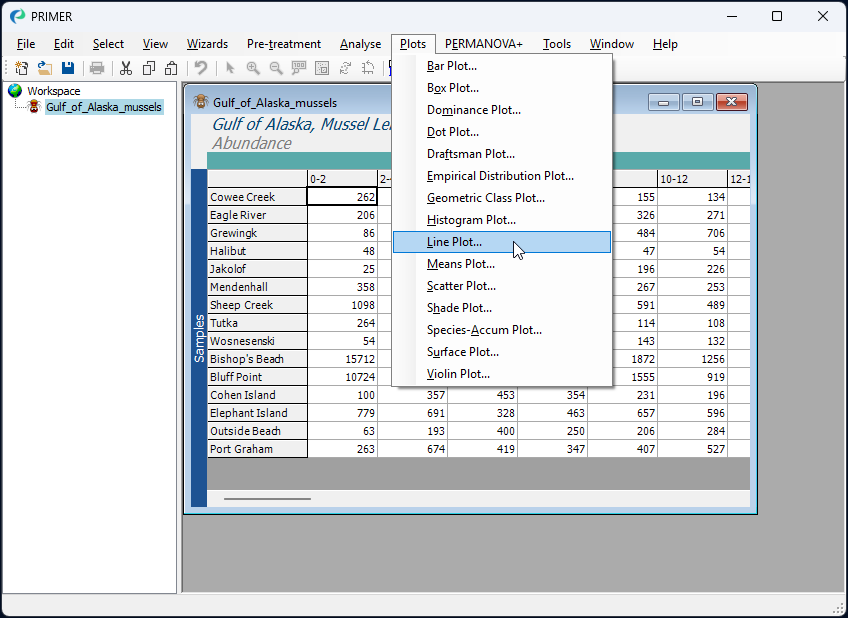
From the mussel data sheet, after standardising the original raw count data to [cumulative percentages](https://learninghub.primer-e.com/link/1063#bkmrk-input-data-and-stand) (the variables are the sizes classes here), resulting in a sheet called 'Data1', we can choose to create a line plot with a line for each sample (the sites here) by clicking **Plots** > **Line Plot...**, like so:
[](https://learninghub.primer-e.com/uploads/images/gallery/2025-07/09c-line-plot-menu-item.png)
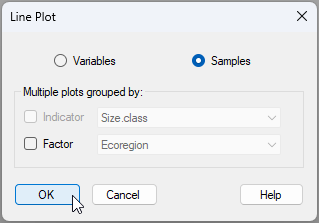
In the 'Line Plot'dialog window, we simply choose to view lines for the ($\bullet$ Samples), and then click '**OK**'.
[](https://learninghub.primer-e.com/uploads/images/gallery/2025-07/09b-line-plot-p8.png)
*Note: change the above dialog if the wording changes*
Note in the above dialog that we also have the option to output ***multiple line plots*** corresponding to groupsof samples identified *via* a factor (or groups of variables identified by an indicator, if we are drawing lines for variables).
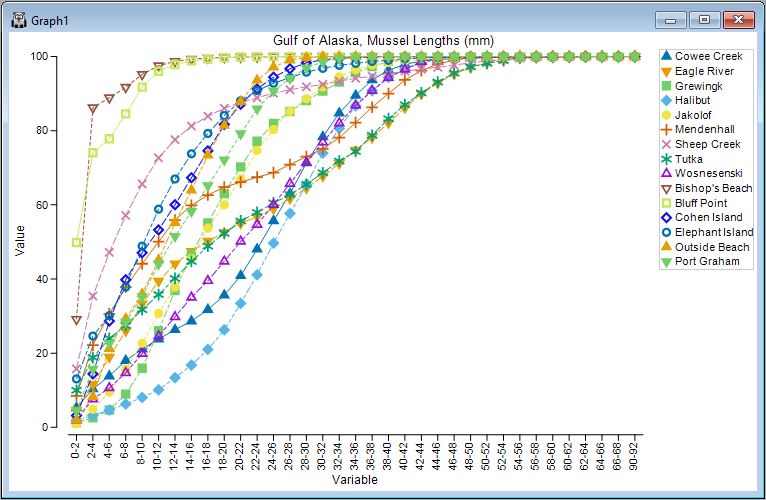
The resulting line plot for this example is shown below:
[](https://learninghub.primer-e.com/uploads/images/gallery/2025-07/09d-line-plot-mussel-data-take2.png)