# 15.7 Output group-level stats from dispersion (or variability) weighting
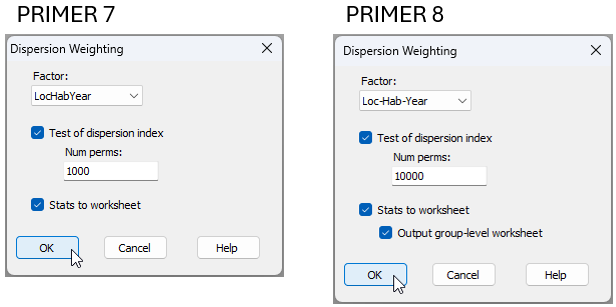
In PRIMER 8, you can now output more detailed statistical information from either dispersion-weighting or variability weighting to a worksheet. You can see this additional option in the comparison of the 'Dispersion Weighting' dialog in PRIMER 8, compared to that in PRIMER 7 (Fig. 15.7).
[](https://learninghub.primer-e.com/uploads/images/gallery/2025-07/10c-dw-comparison-p7-p8.png)
*Fig. 15.7 Comparison of the **Pre-treatment** > **Dispersion Weighting...** dialog window in PRIMER 7 (at left) vs PRIMER 8 (at right).*
In essence, whenever we calculate the average ***index of dispersion*** ($\bar{D}$) for the dispersion weighting pre-treatment, it is drawn from individual indices of dispersion (variance-to-mean ratios, $D_i$) for each of several ($i = 1, \ldots, g$) groups (identified by a factor). It would be helpful, in some situations, to be able to see those original individual indices of dispersion across all of the groups for each variable. The extra tickbox ('$\checkmark$Output group-level worksheet') available in the PRIMER 8 dispersion weighting dialog allows you to produce and examine this underlying statistical information in a worksheet directly.
For example, we can re-visit the data we saw in [section 10.4](https://learninghub.primer-e.com/link/1049) above, located in the file 'NE_NZ_fish_counts.pri', found in the 'Example_P8' > 'NE_NZ_fish' folder. We can begin by following steps 1, 2 and 3 from [section 10.4](https://learninghub.primer-e.com/link/1049) on these data; i.e., get the data into PRIMER 8, then:
- Obtain a subset of the data based on the factor of 'Year', from 2010-2015 inclusive (**Select** > **Samples...**), with the resulting subset being called 'Data1'.
- Create a combined factor consisting of all combinations of the factors: 'Loc', 'Hab' and 'Year' (**Edit** > **Factors...** > **Combine...**)
Next, we can apply the dispersion weighting pre-treatment on the basis of this combined factor by clicking **Pre-treatment** > **Dispersion Weighting...** and in the resulting dialog, choose Factor: Loc-Hab-Year. This time, however, we shall also choose to get ($\checkmark$Stats to worksheet) & ($\checkmark$Output group-level worksheet), then click '**OK**'.
This will produce the following three worksheets (assuming 'Data1' contains the subset-selected data):
- 'Data2' contains the dispersion-weighted data.
- 'Data3' contains the statistics associated with the ***average*** index of dispersion ($\bar{D}$) for each variable.
- 'Data4' contains the ***individual*** indices of dispersion ($D_i$) for each group (columns) and for each variable (rows).
These three data sheets are shown below for the present example.
[![10d._DW_data_[i].png](https://learninghub.primer-e.com/uploads/images/gallery/2025-12/scaled-1680-/10d-dw-data-i.png)](https://learninghub.primer-e.com/uploads/images/gallery/2025-12/10d-dw-data-i.png)
[![10e._D-bar_values_fish_[i].png](https://learninghub.primer-e.com/uploads/images/gallery/2025-12/scaled-1680-/10e-d-bar-values-fish-i.png)](https://learninghub.primer-e.com/uploads/images/gallery/2025-12/10e-d-bar-values-fish-i.png)
[![10f._D_i_values_fish_[i].png](https://learninghub.primer-e.com/uploads/images/gallery/2025-12/scaled-1680-/10f-d-i-values-fish-i.png)](https://learninghub.primer-e.com/uploads/images/gallery/2025-12/10f-d-i-values-fish-i.png)
Note in the above sheet ('Data4', containing individual indices, $D_i$) that there are many missing values. This is simply a consequence of there being zero fish of that species in that particular group of samples; hence, the mean and the variance will both be equal to zero, so no value of $D_i$ can be calculated for that particular cell (or group). Average $\bar{D}$ values for each species are naturally calculated only from those cells (groups of samples) where at least some individuals of that species were recorded (i.e., the non-missing entries).
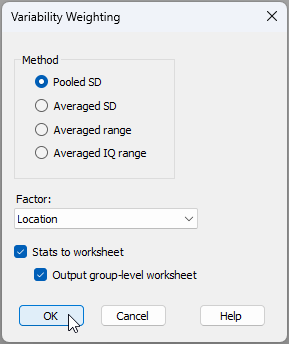
Finally, note that this '$\checkmark$Output group-level worksheet' option is also available for **Pre-treatment** > **Variability Weighting...**, *viz.:*
[](https://learninghub.primer-e.com/uploads/images/gallery/2025-07/10g-variability-weighting-dialog-too.png)