Importing data from Excel
Step 1. Ensure your data are in a format suitable for import into PRIMER
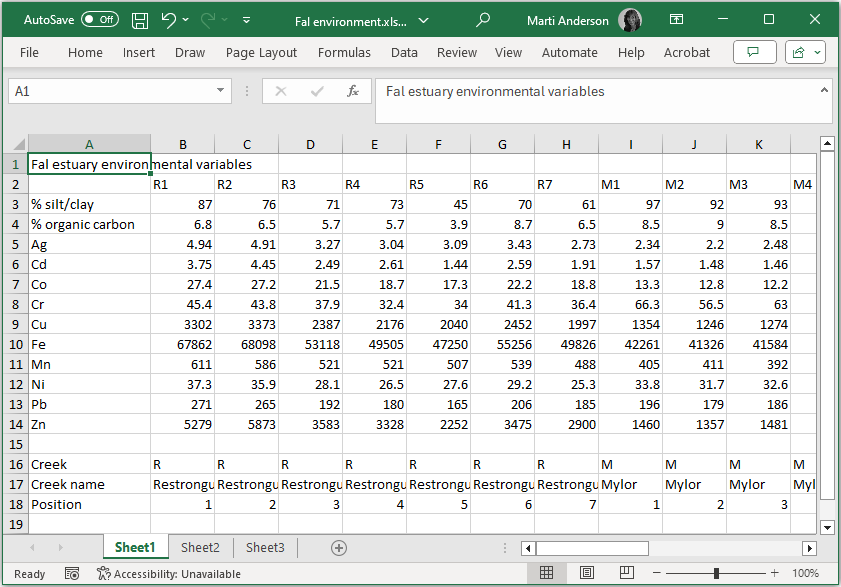
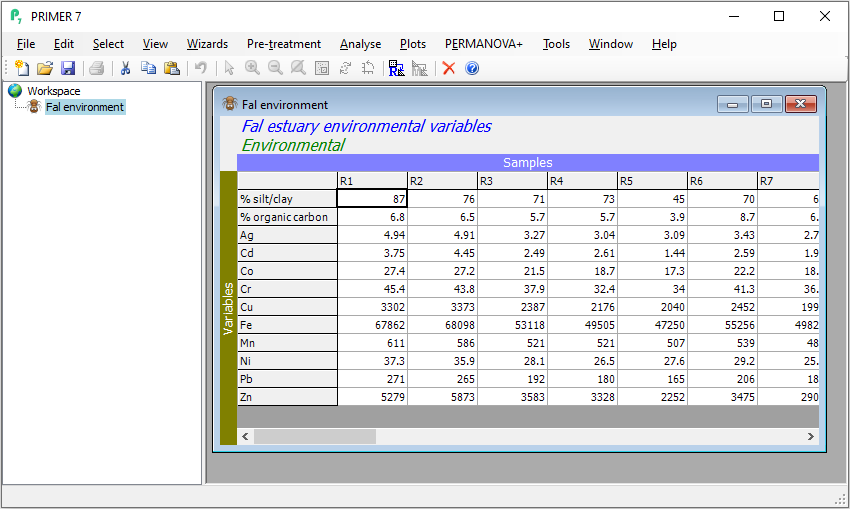
Suppose we have a dataset in Excel that is already in a suitable format for import into PRIMER. The environmental data from the Fal estuary provides an example of this. These data are found in the file 'Fal environment.xls' and consist of values for each of 12 environmental variables measured from sediments collected from 27 sites across 5 tidal creeks in the Fal Estuary (available from within PRIMER by clicking Help > Get Examples Trial..., as seen in the last section).
Important things to note about this file:
- There is a title for the dataset ('Fal estuary environmental variables') in the very first (upper left-hand) cell (A1). This title is optional, but handy as a naming convention.
- The cell immediately under the title (cell A2) is empty.
- There are column labels ('R1', 'R2', ...) in row 2. These are unique labels for the sampling units (Sites in this case).
- There are row labels ('%silt/clay', '% organic carbon', ...) in column A. These are unique names associated with each variable.
- The entries for every cell in the matrix of data itself (beginning with cell B3) all contain numerical values only. There are no non-numeric characters. This means that you may not use 'NaN' or 'NAN' to denote missing values. If data are missing from a cell, then it should be left blank. In addition, symbols such as '<' or '>' (for 'less than' or 'greater than') are similarly not permitted or accepted as valid data values within the data matrix.
- In this example, the variables are rows and the sampling units (sites) are columns. It is perfectly ok to have this formatted the other way around, with variables as columns and sampling units as rows. You will specify the orientation of your data matrix explicitly when you import your Excel file into PRIMER.
This format must be adhered to precisely, with no extra blank rows or columns, or extra headers, otherwise PRIMER will not be able to open it successfully.
Other things to note:
- Factors: You can label the sampling units as belonging to a level of one (or more) factors by skipping a line at the bottom of the matrix and placing this 'factor information' there. In the above image you can see that there are three factors: 'Creek' (row 16), 'Creek name' (row 17) and 'Position' (row 18).
- Indicators: You can similarly label variables as belonging to particular groups in the same manner; this is done along the other margin of the data matrix (e.g., after skipping a column, for this example). This might be useful for doing analyses on subsets of variables belonging to different types, such as physical vs chemical variables. In a case where variables are species, one might want to consider subsets of variables corresponding to families, functional groups, etc.
Inclusion of one (or more) factors (to specify groups of samples) or indicators (to specify groups of variables) is optional. If you have more than one factor, then these are given one after the next (in adjacent rows); do not put blank rows between multiple factors. The initial single blank row (or column) is there simply to demarcate the difference between the data matrix itself and additional information about the data matrix upon import.
Step 2. Open PRIMER and import the data from Excel
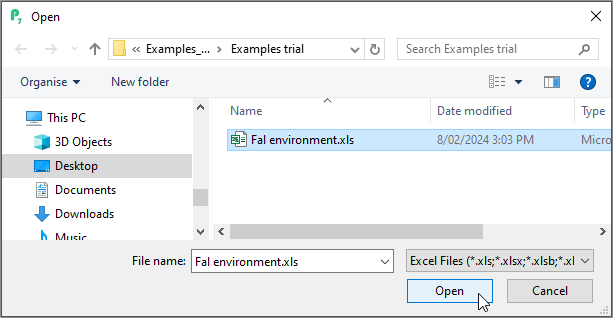
Once your Excel file is ready, open up PRIMER and choose File > Open. Look at the bottom of the dialog box and you will see next to the words 'File name:' that the only files that PRIMER can see is: 'All PRIMER Files...'. Click on 'All PRIMER Files...' and change this to 'Excel Files...'. Once you have done this, you should be able to browse and see the Excel data file that you want.
- Click on the name of your Excel file in the browser (here it is 'Fal environment.xls'), then click Open.
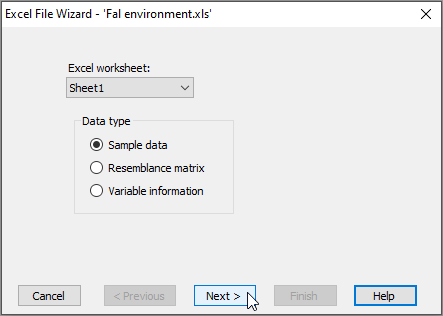
- This will initiate PRIMER's Excel File data-import Wizard. Choose the name of the specific sheet within your Excel file that contains your data and the type of data you are importing. Here, we have (Excel worksheet: Sheet1) & (Data type $\bullet$Sample data), then click Next >.
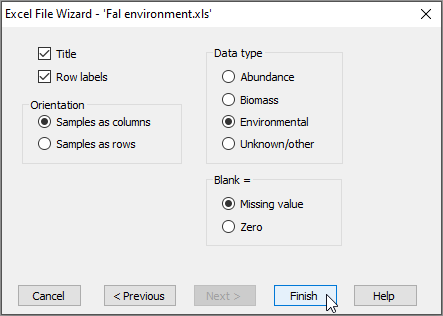
- Choose the correct orientation, type of data and the meaning of blank entries (if any). For this example, we have (Orientation $\bullet$Samples are columns) & (Data type $\bullet$Environmental) & (Blank = $\bullet$Missing value), then click Finish.
- You will now see your data file has been imported and is nicely displayed in the PRIMER workspace. It appears in its own window, and its name also appears in the 'Explorer tree'-type window shown on the left-hand side of the PRIMER desktop.
Now that the data are in PRIMER, it is a good idea to do some post-import data checks.