Step 4 (continued): Key additional details about PERMANOVA in PRIMER
Following the PERMANOVA table of results, a suite of key additional details regarding the analysis can be seen in the PERMANOVA output file.
(Note: It is not necessary to fully unpack all of these details to continue on with the analysis and interpretation of results, but some information is provided here to highlight what makes the implementation of PERMANOVA in PRIMER so unique, surpassing all other software tools in its robust handling of multi-factorial experimental designs).
Additional details in the PERMANOVA output file include:
- details of the expected mean squares (EMS) for each term in the model;
- the construction of the pseudo-F ratios for each term in the model from the appropriate mean squares (along with the associated numerator and denominator degrees of freedom); and
- estimates of the components of variation for each term in the model in the space of the resemblance measure.
For example, scrolling down further in the output file from the PERMANOVA done on the holdfast data, we see:
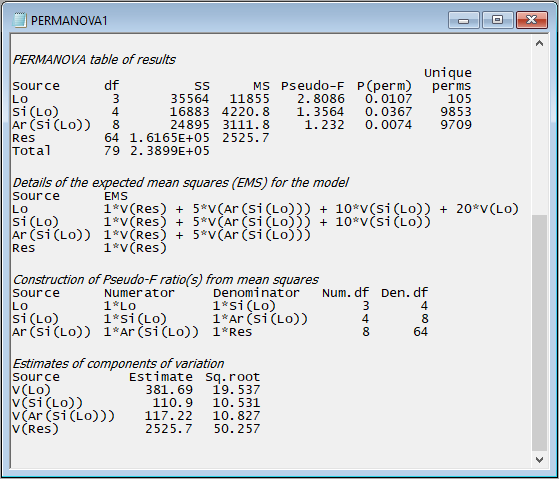
The implementation of PERMANOVA in PRIMER always uses expected mean squares (EMS) to construct correct tests for every term in the model; specifically:
- to construct the correct pseudo-F ratio; and
- to implement a permutation algorithm that
- identifies the correct permutable units; and
- accounts correctly for other terms in the model.
Of course, each term will require careful construction of its own test-statistic and its own permutation algorithm, both of which will depend on whether terms are fixed or random, whether there are other nested terms, covariates or interactions, etc. For unbalanced cases, the 'Type' of sum of squares is also important for the partitioning and correct construction of individual tests. All of these things can affect the EMS.
The EMS are also used to estimate the components of variation attributable to different sources of variation. These are not the same thing as raw $R^2$ values (as are typically used to compare the relative importance of individual predictor variables in regression models). In PERMANOVA, these are calculated in a directly analogous way to the unbiased univariate ANOVA estimators. The column labeled 'Estimate' expresses these components in squared dissimilarity units, and its square root ('Sq.root', interpretable as a sort of standard deviation in the space of the resemblance measure) is also provided.
In the present example, we can see that the greatest variation occurs at the smallest spatial scale - from holdfast to holdfast within a given area (i.e., the square root of 'V(Res)' is 50.257 in Jaccard % dissimilarity units). The sources of variation (in order of importance, as quantified by the PERMANOVA model) are: Residual > Location > Area > Site.
For more information about all of these key additional details provided in the PERMANOVA output file, please consult the PERMANOVA+ manual.