Step 5: ANOSIM test
The ordination plot gives us a visualisation of the rank-order relationships among the samples, based on the dissimilarity measure. Next, we may wish to test the null hypothesis that there are no differences among the five creeks. We can use a non-parametric multivariate permutation test called analysis of similarities (ANOSIM, Clarke (1993) ) for this test. For more details on the ANOSIM test, see also Chapter 6 in 'Change in Marine Communities'. We will be doing a one-way ANOSIM test here (as there is a single factor in this example); for more information on multi-way designs with ordered and/or unordered factors, see Somerfield et al. (2021a) , Somerfield et al. (2021b) and Somerfield et al. (2021c) .
Perform the ANOSIM test
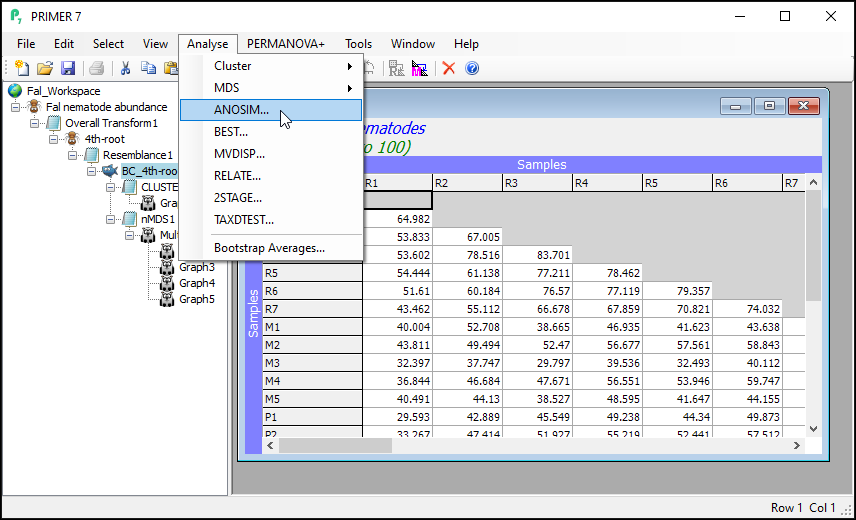
From the Bray-Curtis resemblance matrix (called 'BC_4th-root' in this example), click on Analyse > ANOSIM... and you will see the ANOSIM dialog.
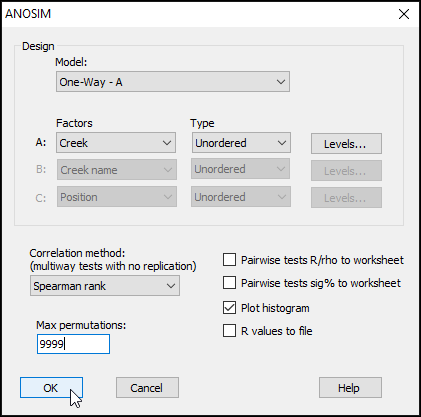
Here, we are performing a one-way ANOSIM (there is just one factor whose levels are un-ordered), so we can leave most of the defaults in the dialog as they are. We should, however, increase the permutations to a larger value, so change the 'Max permutations' from the default value of 999 to 9999, then click 'OK'.
The results, including the overall ANOSIM test for differences among all groups, as well as the ANOSIM tests of all pair-wise comparisons, are provided in the output file called 'ANOSIM1'. The overall test is clearly highly significant, with R = 0.816 and a significance level of 0.01%. This corresponds to a p-value of P = 0.0001 (the smallest possible value attainable for 9999 permutations). Note that, in PRIMER, all p-values are reported for ANOSIM tests as 'significance levels', expressed as a percentage. For example, a p-value of P = 0.0619 would be given in the output file as a significance level of 6.19%.
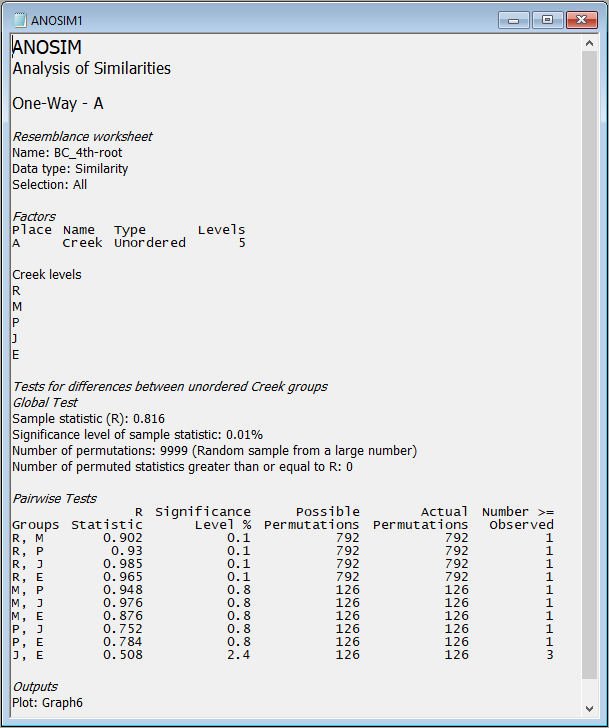
The full set of pairwise tests is performed, and the strength of the differences between any pair of groups is well captured by the relative sizes of the R statistic - larger values indicate groups that are more different (more distinct or more easily distinguishable) from one another. The comparison of assemblages from St Just Creek (J) vs Percuil Creek (E) has the lowest R statistic (R = 0.508) of any tests done in this example, although this difference is still a statistically significant one (P = 0.024). Note that no 'correction' is being made here for multiple tests. The end-user is able to consider applying such a correction if desired (or may perhaps simply consider the frequency of 'significant' results obtained, given the number of tests performed), bearing in mind that each test is done using an exact permutation algorithm in order to generate the individual significance levels produced in the output, ignoring all other tests.
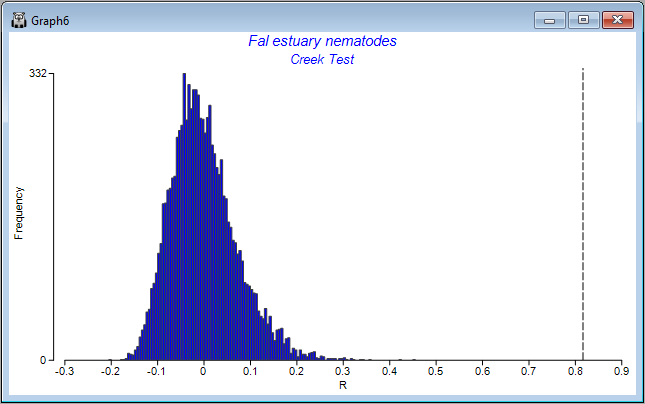
Also provided as output ('Graph6') is a histogram showing the distribution of values of the ANOSIM R statistic under permutation for the overall test. The observed value of the ANOSIM R statistic (0.816) is shown on the plot as a vertical dotted line. The purpose of the histogram is to show visually the departure of the observed value of R (or not) from the distribution of values of R expected under a true null hypothesis of 'no difference' among the groups.