Step 2: Resemblance
For a description of the Bray-Curtis resemblane measure and the rationale for its use with biotic data, see Clarke et al. (2006) and Chapter 2 in 'Change in Marine Communities'.
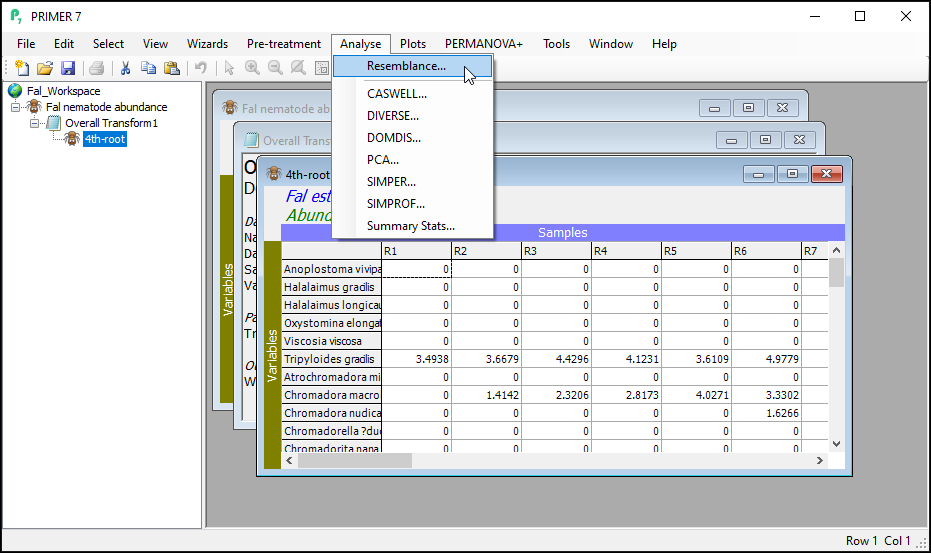
- With the data sheet named '4th-root' from the previous step as the active window, click on Analyse > Resemblance...
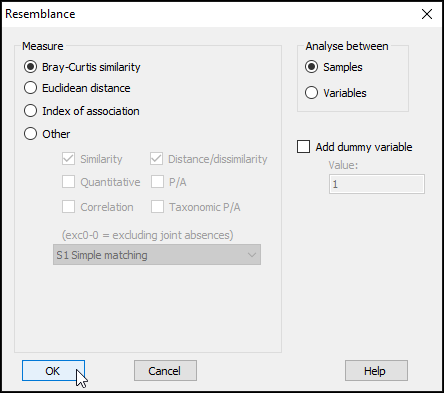
This dialog has a host of choices for you to consider, which you can uncover by clicking on the '$\bullet$Other' radio button. See Clarke et al. (2006) and chapter 7 in Legendre & Legendre (2012) for more details regarding the available choices here. For this example, however, we are going to use the Bray-Curtis resemblance measure. (This is the default for data of type 'Abundance').
- In the 'Resemblance' dialog, under 'Measure', click on $\bullet$Bray-Curtis similarity (the default), then click OK.
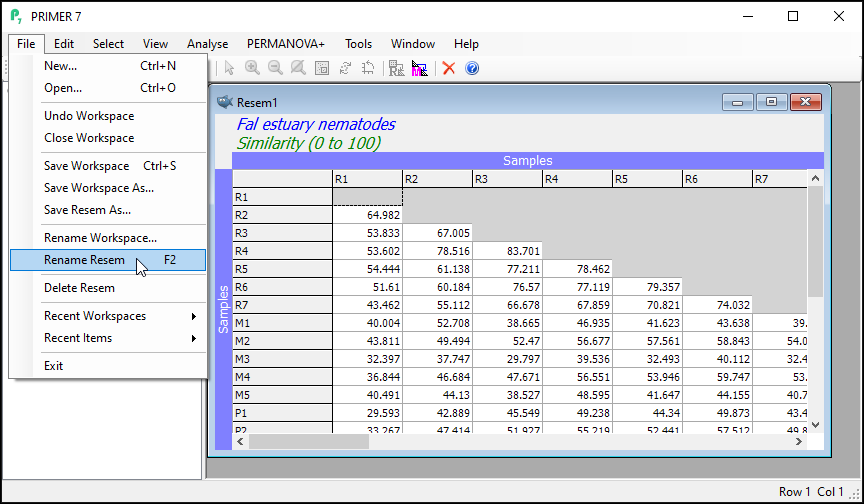
You will see the resulting (lower triangular form of the) matrix of Bray-Curtis similarities between every pair of samples (called 'Resem1').
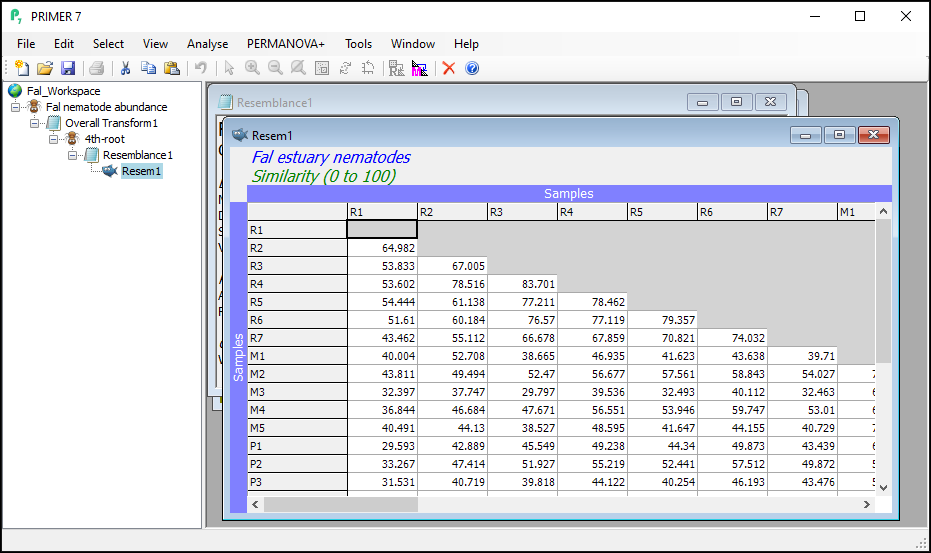
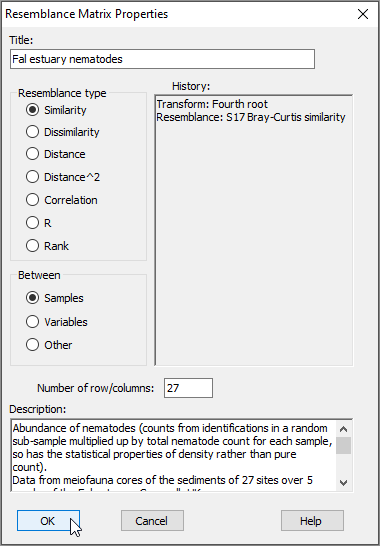
Notice that this will inherit relevant properties and also factors that were associated with the dataset from which it was generated. From the 'Resem1' matrix as the active window, click on Edit > Properties to see the properties associated with this resemblance matrix (shown below); you can also click on Edit > Factors to see the factors (which have not changed).
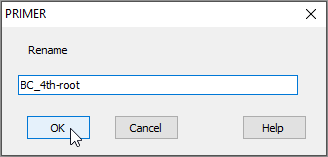
- It is (once again) good practice to re-name the sheet containing the resulting resemblance matrix (currently called 'Resem1') something that would be more useful for future reference. Click on the 'Resem1' sheet, then click on File > Rename Resem and call it 'BC_4th-root' for clarity in ensuing analyses.