4.10 Example: Ekofisk diversity
To demonstrate the test of association, we shall re-visit a dataset of macrofauna assemblages collected from sites near an oilfield in the North Sea. In this study by Gray et al. (1990) , macrofauna were sampled from 39 sites in an approximately 5-spoke radial design, at increasing distances from undersea drilling activities at the Ekofisk oilfield. There were three day-grab samples taken from each site; information from these were combined to yield abundance values for each of $p$ = 173 soft-sediment macrofaunal taxa at every site. The macrofauna data are given in the file 'Ekofisk_macrofauna_counts.pri', found in the 'Examples_P8 > Ekofisk_macrofauna' folder. Environmental variables were also obtained at each site, and these, along with the actual distance from the oilfield centre, are given in the file 'Ekofisk_environment.pri'. Open up both of these files in PRIMER, as shown below:
![01.Ekofisk_Test_of_Assoc_start[i].png](https://learninghub.primer-e.com/uploads/images/gallery/2025-12/01-ekofisk-test-of-assoc-start-i.png)
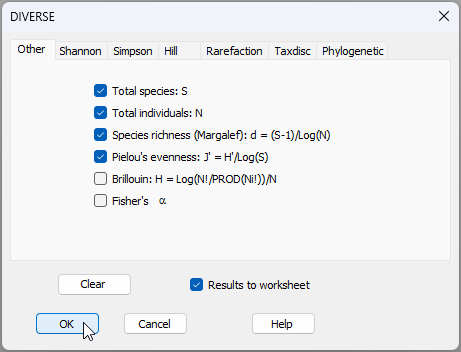
Does species richness increase or decrease with increasing distance from the oil platform? Let's start by calculating some simple univariate diversity metrics, such as $S$ = total richness (the number of taxa), along with some others. From the Ekofisk_macrofauna_counts data sheet inside PRIMER, click Analyse > DIVERSE....
![02.Ekofisk_Diverse_a[i].png](https://learninghub.primer-e.com/uploads/images/gallery/2025-12/02-ekofisk-diverse-a-i.png)
We can take all of the default options here, but also tick the option to output ($\checkmark$Results to worksheet), then click 'OK'.
You can (optionally) re-name the resulting data sheet of diversity metrics (called 'Data1') by clicking on that sheet, then click File > Rename Data and type a new name 'Diversity', then click 'OK'. The suite of univariate diversity metrics, calculated on each sampling unit, are now evident in this renamed data sheet, as follows:
![03.Diversity_default_Ekofisk[i].png](https://learninghub.primer-e.com/uploads/images/gallery/2025-12/03-diversity-default-ekofisk-i.png)
Run the test of association
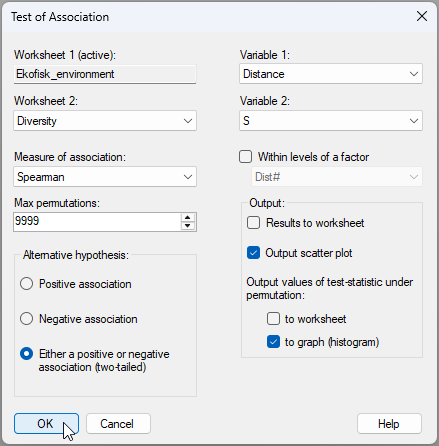
Now, let's run the test of association. We wish to test the null hypothesis of 'no association' between species richness (the variable called 'S' in the 'Diversity' data sheet) and distance from the oil platform's drilling activity (the variable called 'Distance' in the 'Ekofisk_environment' data sheet). From the 'Ekofisk_environment' data sheet, click Analyse > Univariate > Association....
![04.Association_Dist.&.S_Ekofisk[i].png](https://learninghub.primer-e.com/uploads/images/gallery/2025-12/04-association-dist-s-ekofisk-i.png)
Complete the relevant information required for this test into the resulting dialog window, as shown below, then click 'OK'.
Results of the test of association
You will see the following output (called 'Test of association1' in the Explorer tree window).
![06.Association_Dist.&.S_results[i].png](https://learninghub.primer-e.com/uploads/images/gallery/2025-12/06-association-dist-s-results-i.png)
Additional output for this example includes two graphics. First, there is a histogram of the values of the test statistic (here, Spearman's rank correlation, rho $= \rho_{\tiny{S}}$ ) obtained under permutation ('Graph1'), viz:
![07.Histogram_of_rho[i].png](https://learninghub.primer-e.com/uploads/images/gallery/2025-12/07-histogram-of-rho-i.png)
Second, there is a scatterplot of the two variables ('Graph2'), where whatever variable was provided as 'Variable 1' in the dialog will be the x-axis, and the variable named as 'Variable 2' will be the y-axis, as shown here:
![08.Scatterplot_Dist.&.S[i].png](https://learninghub.primer-e.com/uploads/images/gallery/2025-12/08-scatterplot-dist-s-i.png)
Interestingly, although some samples close to the platform (i.e., S37, S30 and S29) had quite low values for species richness compared to most other sites, there is nevertheless a negative rank correlation measured between species richness and distance from the oil platform ($ \rho_{\tiny{S}}$ = -0.2762); however, this was not statistically significant overall ($P$ > 0.08) according to the test. Indeed, in many practical ecological applications, univariate diversity measures may or may not show a very strong directional pattern of response to environmental impact. In contrast, multivariate analyses of community structure, holistically, will tend to pick up significant effects that can then be characterised in terms of simultaneous changes in relative occurrences and/or abundances across a suite of component species.